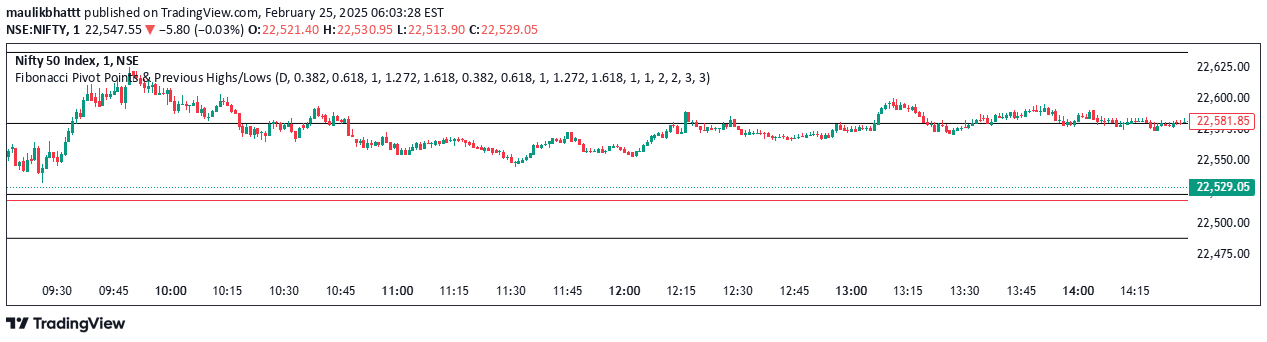
A multi-timeframe support and resistance indicator that helps traders identify critical price levels across daily, weekly, monthly, quarterly, and yearly timeframes.
Explore complementary indicator rolesHow it works
The HTF Support/Resistance indicator analyzes price action across multiple timeframes, automatically identifying key support and resistance levels. It calculates these levels by examining the open, high, and low prices for different time periods including daily, weekly, monthly, quarterly, and yearly intervals.
Traders can customize the indicator's appearance, choosing specific colors and line styles for each level. The indicator also provides an option to extend support and resistance lines across the entire chart, making it easier to visualize potential price interaction zones and critical market levels.
Why it may be useful
Understanding support and resistance levels is crucial for making informed trading decisions, as these levels represent key psychological price points where market sentiment can shift. By providing insights across multiple timeframes, this indicator helps traders identify potential entry and exit points, manage risk, and develop more comprehensive trading strategies.
The multi-timeframe approach allows traders to see both short-term and long-term market dynamics, bridging the gap between immediate price action and broader market trends. This comprehensive view can help traders make more nuanced and strategic trading decisions.
When to explore it
This indicator is most effective when traders want to gain a comprehensive view of market dynamics across different time horizons. It is particularly useful during periods of market uncertainty, when understanding key support and resistance levels can provide critical insights into potential price movements.
Traders can benefit from this tool in various market conditions, whether they are analyzing intraday price action or studying long-term trend patterns. It is especially valuable for traders who want to align their strategies with broader market trends and identify potential turning points in price action.
Keep exploring
What we’ve verified
Access, alerts and repainting behaviour have not been independently verified for this indicator. Check the creator’s current publication and settings.
General descriptions and classifications are recovered research. Verified details above identify the specific checks we have completed. Check the creator’s current publication for later changes.