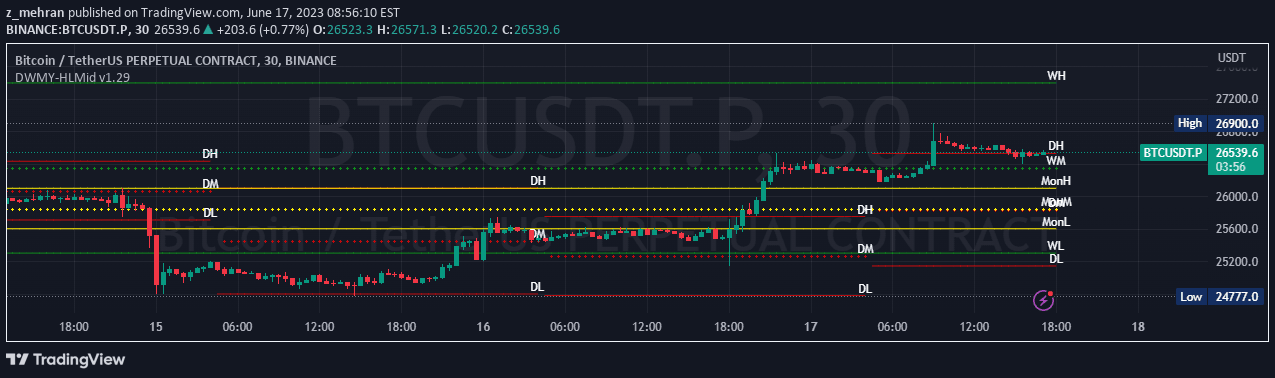
A multi-timeframe signal analyzing price stacks across pre/post market and daily, weekly, monthly, and yearly sessions with customizable alerts and table positioning.
Explore complementary indicator rolesHow it works
The signal operates by tracking multiple price stacks across different market sessions, utilizing incremental values to swap and analyze high, low, open, and close data. It creates flexible visualizations with customizable columns, rows, tooltips, and color schemes that adapt to various timeframes from pre-market to yearly sessions.
Users can configure stack values to shift between different time periods, enabling dynamic analysis of price movements. The system allows for precise tracking of market behavior by generating detailed comparisons across different session types and timeframes.
Why it may be useful
This signal provides traders with a comprehensive view of price action across multiple timeframes, enabling more nuanced market analysis and decision-making. By offering granular insights into price movements, traders can identify potential trends, support/resistance levels, and market dynamics that might be overlooked in traditional single-timeframe analysis.
The customizable nature of the signal allows traders to adapt their analysis to specific market conditions, asset types, and personal trading strategies, making it a versatile tool for different trading approaches and market environments.
When to explore it
The signal is most effective during periods of market transition or when analyzing complex price movements across different timeframes. It works particularly well for traders seeking to understand broader market trends while maintaining flexibility in their analytical approach.
Traders can leverage this signal during volatile market conditions, when transitioning between different trading sessions, or when attempting to identify subtle price patterns that might not be apparent in standard chart analysis. It is especially useful for traders dealing with multiple asset classes like stocks, futures, and cryptocurrencies.
Keep exploring
What we’ve verified
Access, alerts and repainting behaviour have not been independently verified for this indicator. Check the creator’s current publication and settings.
General descriptions and classifications are recovered research. Verified details above identify the specific checks we have completed. Check the creator’s current publication for later changes.