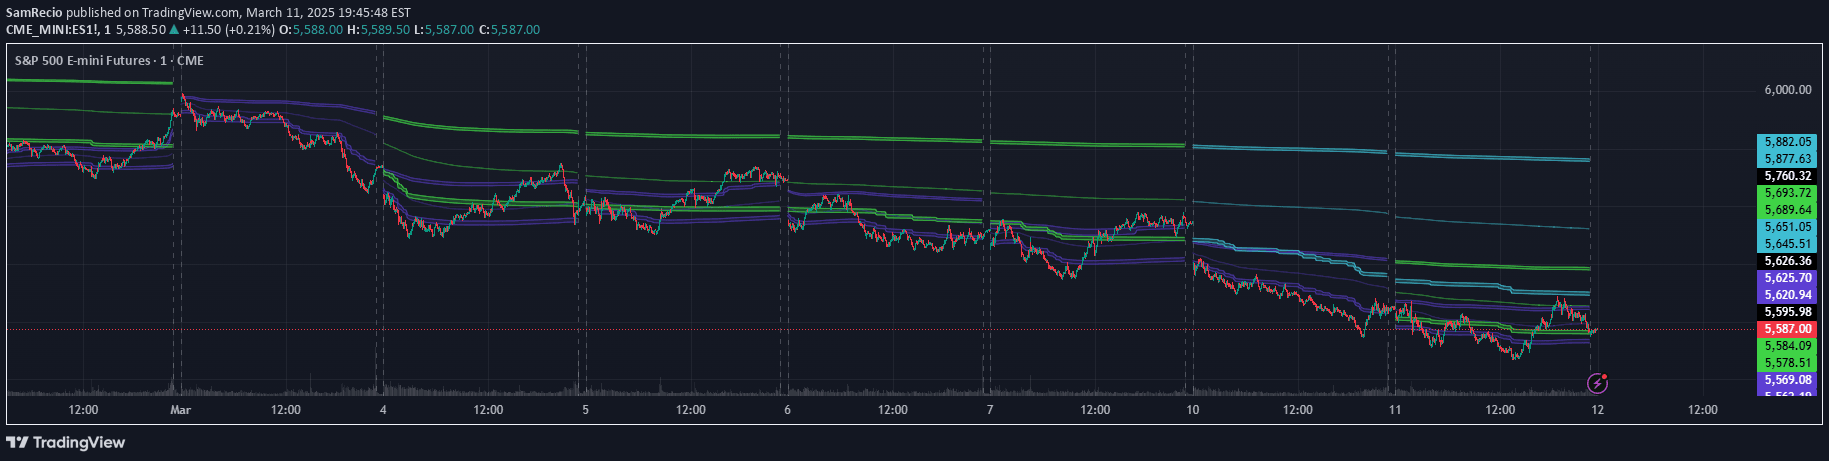
VWAP Balance Zones track daily, weekly, and monthly highs and lows, plotting a 50% average between VWAP and market extremes to identify potential equilibrium points.
Explore complementary indicator rolesHow it works
VWAP Balance Zones calculate the midpoint between the Volume Weighted Average Price (VWAP) and daily, weekly, or monthly price extremes. The system tracks high, low, and close prices to create these balanced zones, which represent potential equilibrium points between buyers and sellers.
By generating these zones at the 50% level, the indicator creates dynamic reference points that adapt to current market conditions. The zones are primarily focused on daily price action, with weekly and monthly calculations also performed but typically not displayed to minimize chart complexity.
Why it may be useful
VWAP Balance Zones provide traders with a nuanced view of market dynamics by highlighting potential areas of equilibrium and market sentiment. These zones help identify potential entry and exit points by revealing where supply and demand might be balanced, offering insights into possible trend continuation or reversal.
By tracking these balanced zones, traders can gain a deeper understanding of market psychology and potential decision points. The zones offer a visual representation of where market participants might be considering value entries or sensing potential trend changes.
When to explore it
VWAP Balance Zones are most effective in actively traded markets with sufficient volume and clear price trends. They work best for intraday and short-term trading strategies, particularly for traders seeking to understand market equilibrium and potential trend dynamics.
The indicator is particularly useful during periods of market consolidation or when price is approaching key levels. Traders should combine these zones with other technical analysis tools to confirm signals and improve decision-making accuracy.
Keep exploring
What we’ve verified
Access, alerts and repainting behaviour have not been independently verified for this indicator. Check the creator’s current publication and settings.
General descriptions and classifications are recovered research. Verified details above identify the specific checks we have completed. Check the creator’s current publication for later changes.