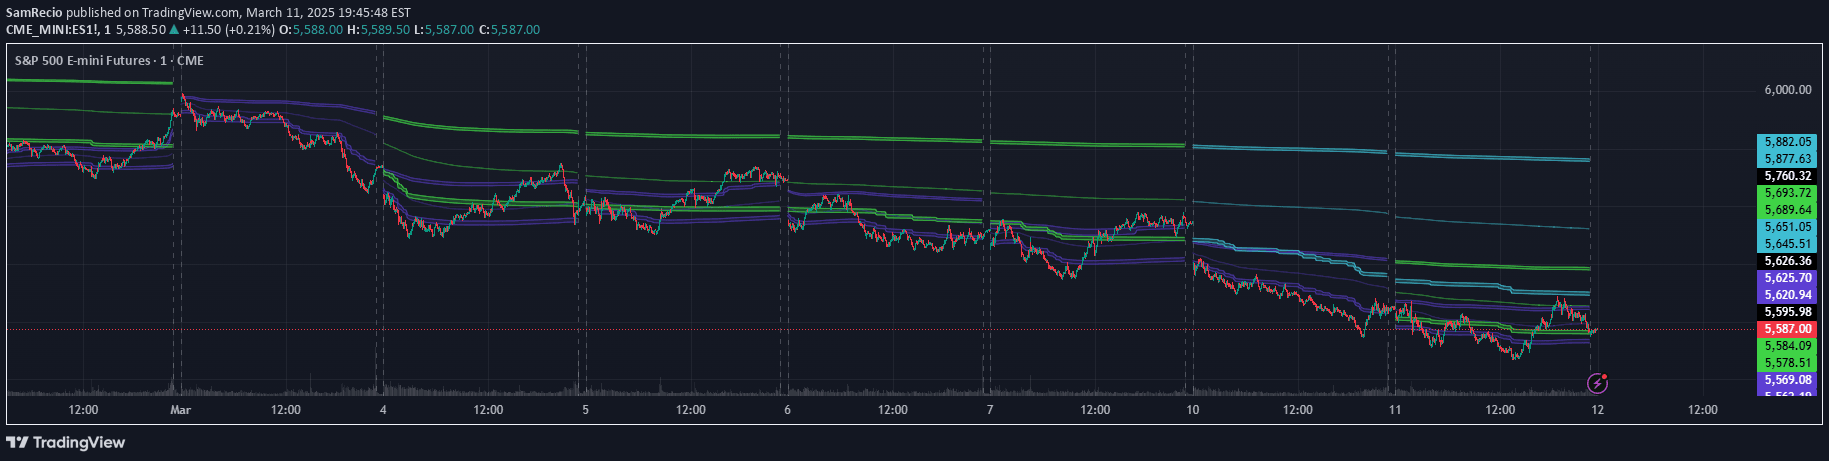
CANDLE LEVELS [PRO]
A multi-timeframe indicator providing 55 price levels across different time frames, helping traders identify key support and resistance zones with customizable visualization.
Explore 11,183 indicators. Filter beyond the obvious.
Discover the tools that fit the way you trade.
11,183 tools to explore
A multi-timeframe indicator providing 55 price levels across different time frames, helping traders identify key support and resistance zones with customizable visualization.
A trading script that highlights previous day's high and low levels, automatically marking breakouts and drawing intraday Fibonacci levels for quick visual reference.
VWAP Balance Zones track daily, weekly, and monthly highs and lows, plotting a 50% average between VWAP and market extremes to identify potential equilibrium points.
VWAP Balance Zones Sessions identifies market equilibrium areas by averaging daily extremes and VWAP, providing traders with dynamic support and resistance levels across different timeframes.
A multiple timeframe levels indicator that plots high, low, and midpoint lines across different time horizons to help traders identify key support and resistance zones.
Likes, views, and comments are historical TradingView snapshots. They describe attention, not trading performance.