Quarterly Earnings
A TradingView script that displays quarterly earnings per share and sales data with year-on-year percentage changes, offering customizable visualization of financial performance metrics.
Explore 11,183 indicators. Filter beyond the obvious.
Discover the tools that fit the way you trade.
11,183 tools to explore
A TradingView script that displays quarterly earnings per share and sales data with year-on-year percentage changes, offering customizable visualization of financial performance metrics.
A price projection tool that forecasts future market behavior by analyzing historical price patterns and applying a user-defined growth factor to simulate potential price movements.
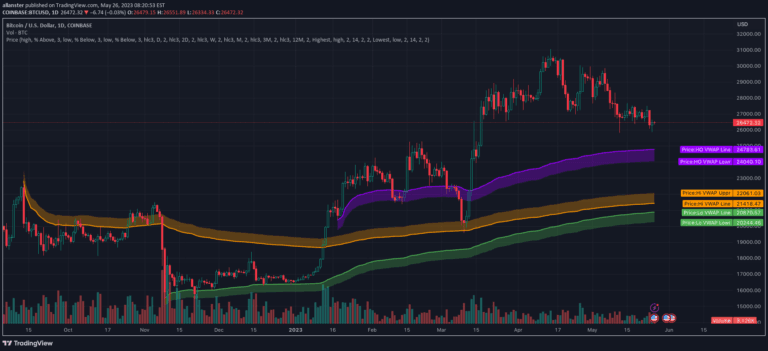
A Volume Weighted Average Price (VWAP) tool that plots VWAP close levels across multiple timeframes, helping traders identify key support and resistance levels.
The Diluted Earnings Per Share Signal (DEPSS) is a fundamental indicator that analyzes earnings surprises by comparing diluted EPS to analyst estimates to generate trading signals.
An advanced VWAP toolbox that provides multiple anchored VWAP techniques, including pinch and handoff strategies, periodic intervals, and automatic anchor selection for technical analysis.
A seasonality indicator that analyzes an asset's historical performance across daily, monthly, and quarterly timeframes, revealing patterns of market behavior throughout the year.
A financial analysis tool that compares quarterly, annual, and TTM performance metrics, providing comprehensive insights into company growth through various financial indicators and visualization options.
A comprehensive trading tool that compares fundamental metrics across multiple assets using various charting methods, enabling detailed financial analysis and visualization.
SMT Divergence identifies potential market reversals by comparing price behaviors between two correlated assets, revealing subtle signs of market manipulation and trend shifts.
AMDX strategy divides the trading day into four distinct phases, providing a structured approach to understanding market behavior and institutional trading patterns.
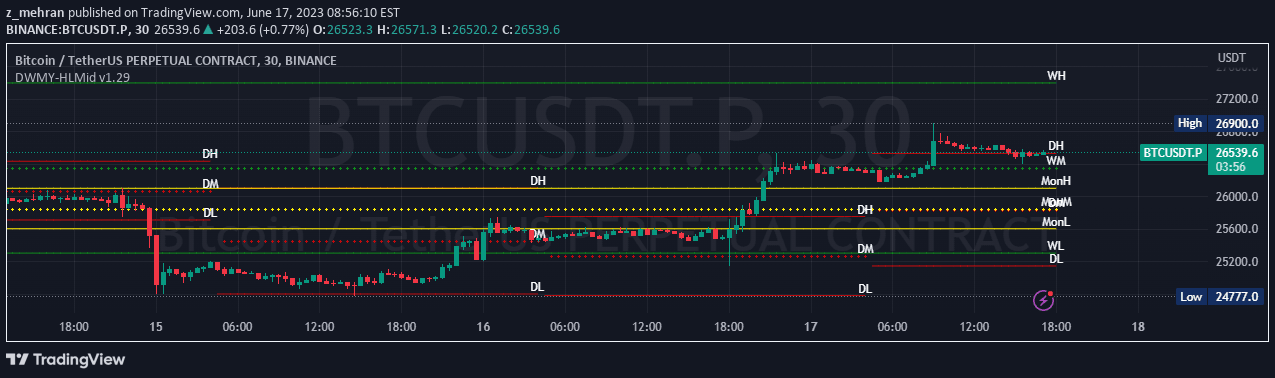
A multi-timeframe support and resistance indicator that helps traders identify critical price levels across daily, weekly, monthly, quarterly, and yearly timeframes.
A comprehensive price level indicator that tracks daily, weekly, monthly, quarterly, and yearly high, mid, and low values to help traders analyze market movements and identify key support and resistance levels.
Likes, views, and comments are historical TradingView snapshots. They describe attention, not trading performance.