
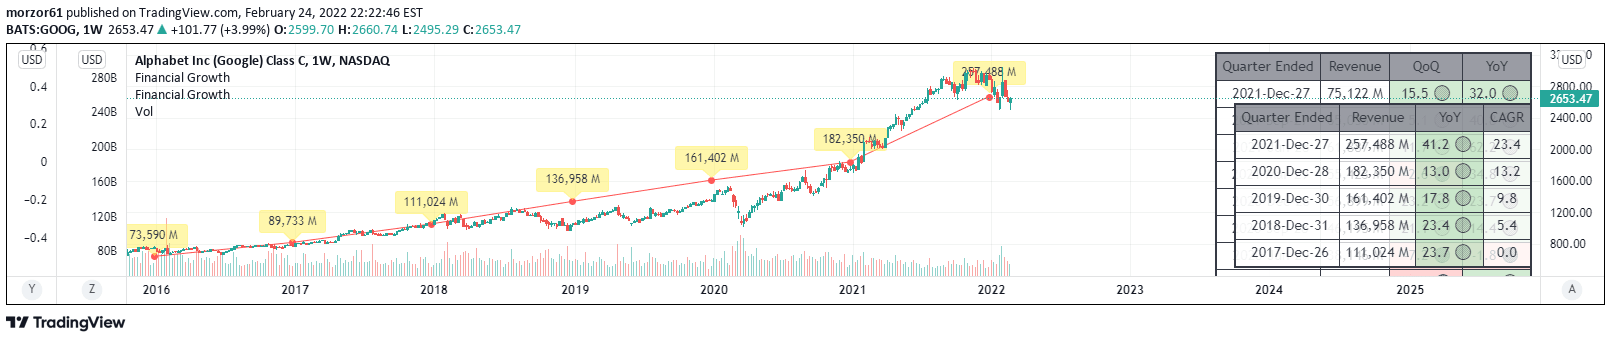
A financial analysis tool that compares quarterly, annual, and TTM performance metrics, providing comprehensive insights into company growth through various financial indicators and visualization options.
Explore complementary indicator rolesHow it works
The indicator retrieves financial data from Tradingview and performs comparative analysis across different time periods. It calculates key financial metrics including Year-over-Year (YoY), Quarter-over-Quarter (QoQ), and Compound Annual Growth Rate (CAGR).
Users can select specific financial data points such as Revenue, Net Income, EBITDA, EPS, and others. The tool generates percentage growth comparisons between Quarter, Annual, and Trailing Twelve Months (TTM) periods. Visual representations can be customized through toggle options for plotting lines, labels, and data tables
Why it may be useful
This financial analysis tool provides investors and traders with comprehensive insights into a company's performance and growth trajectory. By comparing multiple financial metrics across different time periods, users can quickly assess a company's financial health and potential.
The ability to visualize data through charts, labels, and tables enables more informed investment decisions. The tool's flexibility allows for detailed examination of key financial indicators, helping users understand trends, growth rates, and potential future performance
When to explore it
This indicator is most useful when conducting fundamental analysis of stocks or companies. It is particularly valuable during earnings season, when comparing quarterly financial reports, or when evaluating long-term investment opportunities.
Investors can use this tool to assess company performance across different time frames, identify consistent growth patterns, and compare financial metrics. It is especially helpful for those interested in understanding a company's financial trajectory, making strategic investment decisions, and conducting comprehensive financial research
Keep exploring
What we’ve verified
Access, alerts and repainting behaviour have not been independently verified for this indicator. Check the creator’s current publication and settings.
General descriptions and classifications are recovered research. Verified details above identify the specific checks we have completed. Check the creator’s current publication for later changes.


