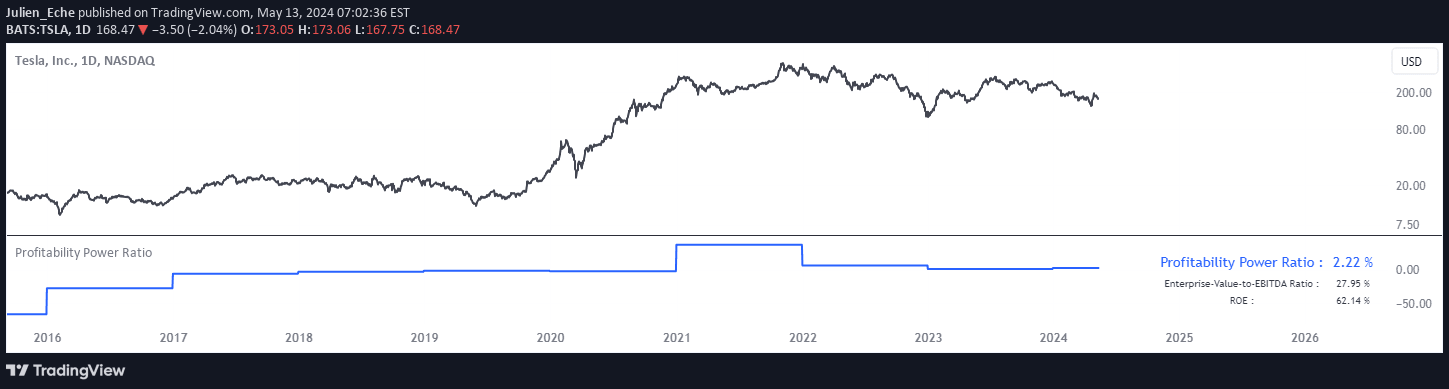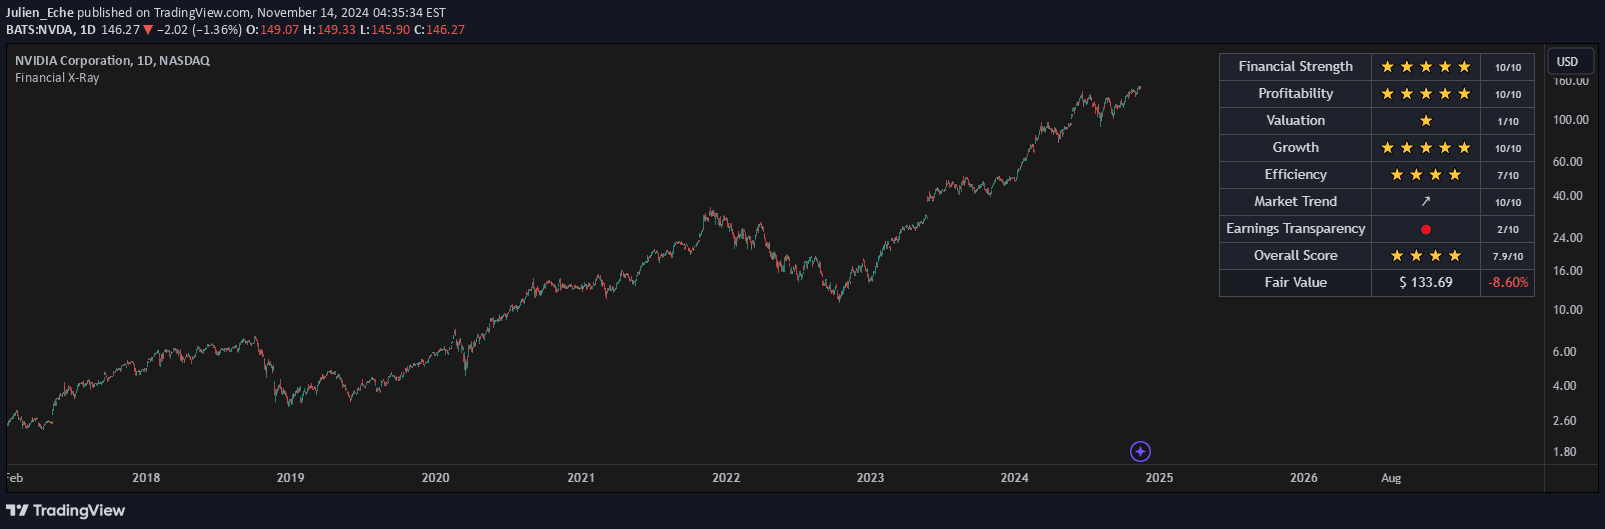
A comprehensive financial analysis tool that provides normalized scores and fair value estimates for companies, enabling quick and contextual financial performance assessment.
Explore complementary indicator rolesHow it works
The Financial X-Ray systematically collects comprehensive financial data across multiple dimensions, including financial strength, profitability, valuation, growth, and operational efficiency. It leverages an advanced algorithm that normalizes metrics specific to each company's industry sector, ensuring more meaningful comparative analysis.
The indicator then converts each financial metric into a standardized score ranging from 0 to 10, allowing traders and investors to quickly understand a company's performance. By integrating sector-specific adjustments and utilizing advanced calculation methods, the tool provides a nuanced and objective assessment of a company's financial health.
Why it may be useful
The Financial X-Ray simplifies complex financial analysis by transforming intricate data into easily digestible insights, enabling investors to make more informed decisions without spending hours manually researching and comparing financial metrics. Its objective, data-driven approach reduces emotional bias and provides a structured framework for evaluating potential investments.
By offering normalized scores and fair value estimates, the indicator helps investors identify undervalued or overvalued companies within their specific sector. The tool's ability to provide contextual analysis means investors can quickly understand a company's performance relative to its industry peers, enhancing the overall quality of investment decision-making.
When to explore it
The Financial X-Ray is most effective when conducting comprehensive fundamental analysis, particularly for investors interested in long-term investment strategies and detailed company evaluations. It is particularly useful during earnings seasons, when investors are seeking to compare companies within the same sector and assess their relative financial strengths.
Investors should utilize this tool when making strategic investment decisions, such as portfolio rebalancing, identifying potential growth opportunities, or conducting deep-dive financial assessments. The indicator is especially valuable for those who prefer data-driven approaches and want a quick yet thorough understanding of a company's financial performance.
Keep exploring
What we’ve verified
Access, alerts and repainting behaviour have not been independently verified for this indicator. Check the creator’s current publication and settings.
General descriptions and classifications are recovered research. Verified details above identify the specific checks we have completed. Check the creator’s current publication for later changes.