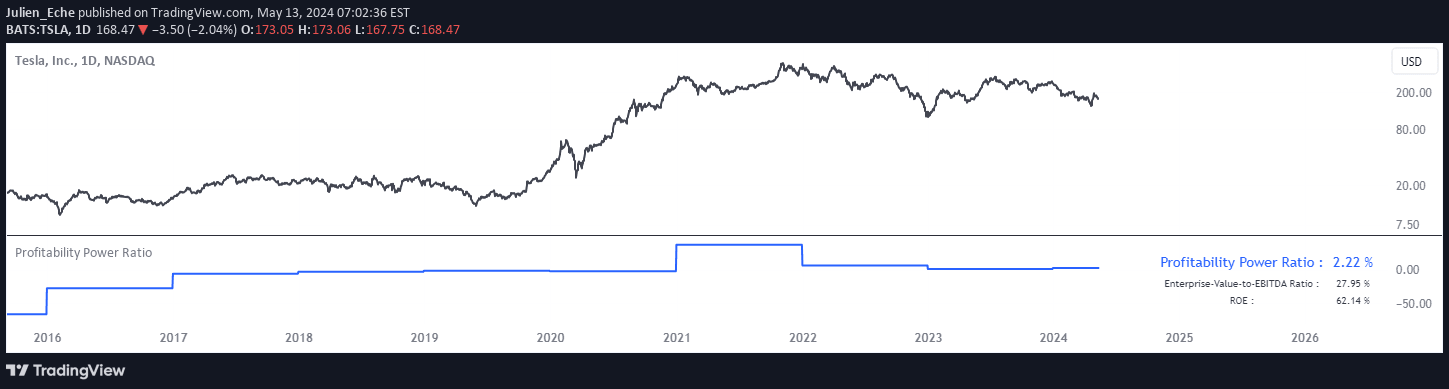
The Dividend-to-ROE Ratio evaluates a company's dividend policy by comparing dividend payout to return on equity, offering insights into financial health and shareholder value.
Explore complementary indicator rolesHow it works
The Dividend-to-ROE Ratio is calculated by dividing the dividend payout ratio by the return on equity (ROE). This metric provides a comprehensive view of how a company distributes its earnings to shareholders relative to its profitability. By comparing the proportion of earnings paid out as dividends to the overall return generated from shareholder equity, investors can assess the company's financial strategy.
The ratio helps investors understand management's approach to capital allocation. A higher ratio indicates more earnings are being returned to shareholders, while a lower ratio suggests the company is reinvesting profits into future growth and operational expansion.
Why it may be useful
The Dividend-to-ROE Ratio is crucial for investors seeking to understand a company's financial health and dividend sustainability. It provides insights into management's strategic decisions regarding profit distribution and reinvestment. By examining this ratio, investors can gauge the balance between rewarding shareholders and supporting future growth.
This indicator is particularly valuable for income-oriented investors and financial analysts. It offers a nuanced view of a company's financial performance, helping stakeholders assess the long-term viability of the company's dividend policy and its potential for generating consistent returns.
When to explore it
The Dividend-to-ROE Ratio is most effective when used for long-term investment analysis and comparative assessments within specific industries. It works best when evaluating stable, mature companies with consistent financial performance. Investors should use this ratio as part of a comprehensive financial analysis, comparing it with industry benchmarks and other financial metrics.
This indicator is particularly useful for income-focused investors, value investors, and those conducting fundamental analysis. It provides valuable context when assessing potential investments, helping to identify companies with sustainable dividend policies and strong financial management.
Keep exploring
What we’ve verified
Access, alerts and repainting behaviour have not been independently verified for this indicator. Check the creator’s current publication and settings.
General descriptions and classifications are recovered research. Verified details above identify the specific checks we have completed. Check the creator’s current publication for later changes.