Dividend Calendar (Zeiierman)
A comprehensive dividend tracking tool that helps investors analyze dividend payouts, forecast income, and make strategic investment decisions across various stocks and sectors.
Explore 11,183 indicators. Filter beyond the obvious.
Discover the tools that fit the way you trade.
11,183 tools to explore
A comprehensive dividend tracking tool that helps investors analyze dividend payouts, forecast income, and make strategic investment decisions across various stocks and sectors.
A comprehensive market analysis tool tracking cross-market correlations and equity factor performance across multiple assets to provide probabilistic insights into macro market regimes and potential future movements.
CANSLIM is an advanced stock screening strategy that evaluates companies across seven critical growth indicators to identify potentially high-performing stocks in the market.
A Pine Script method for retrieving financial event data like earnings reports, stock splits, and dividend information using TradingView's inner data representation system.
A comprehensive financial ratio indicator for the S&P 500 that provides detailed insights into market valuation, earnings, and performance using multiple financial metrics.
A comprehensive index tracking total stock performance by combining price changes and dividend returns, offering investors a complete view of investment performance over time.
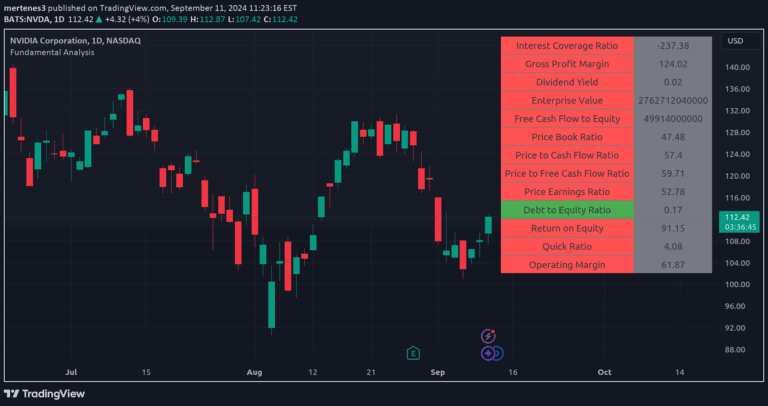
A comprehensive financial metrics indicator that provides quick, color-coded insights into a company's financial health through multiple essential ratios and performance indicators.
A stock valuation tool that calculates intrinsic value by analyzing financial metrics and provides a margin of safety to help investors make informed investment decisions.
An indicator that compares free cashflow per share with dividend per share, helping investors assess a company's ability to sustain dividend payments through operational cash generation.
A comprehensive stock valuation method that combines multiple financial metrics to assess stock value using a multi-factor rainbow spectrum approach.
A comprehensive financial yield comparison tool that plots earnings and dividend yields for S&P500 and individual stocks alongside treasury and corporate bond rates.
A trading strategy combining fundamental value and dividend growth analysis with technical indicators to identify potential buy and sell signals based on moving averages and price momentum.
Likes, views, and comments are historical TradingView snapshots. They describe attention, not trading performance.