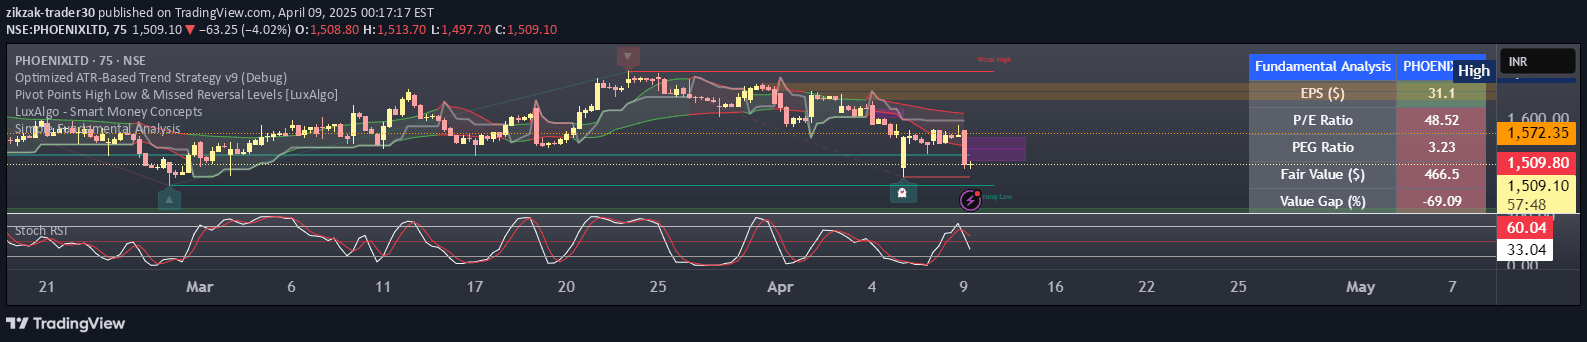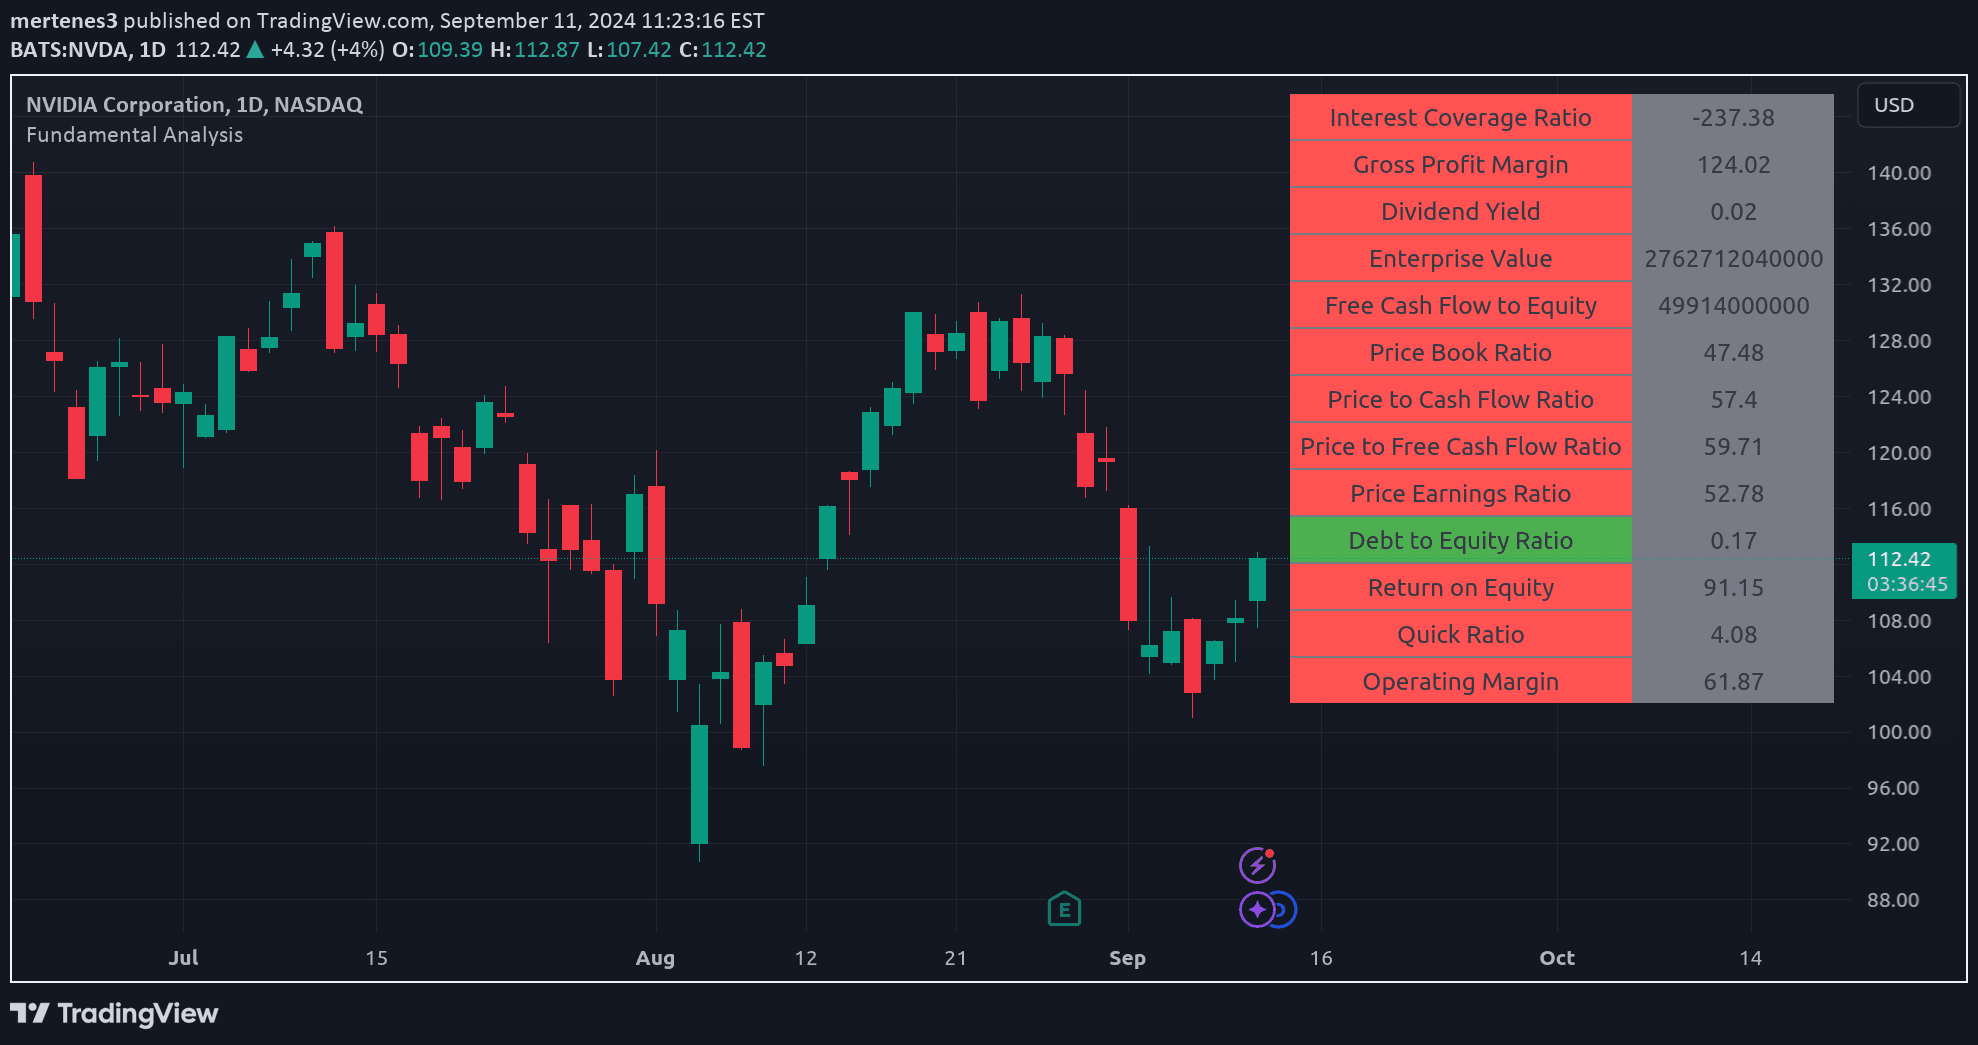
A comprehensive financial metrics indicator that provides quick, color-coded insights into a company's financial health through multiple essential ratios and performance indicators.
Explore complementary indicator rolesHow it works
The financial metrics indicator compiles and displays multiple critical financial ratios directly on the trading chart, using a color-coded system to represent each metric's performance. Each financial metric is algorithmically calculated and compared against industry benchmarks to provide an immediate visual assessment of a company's financial condition.
The system analyzes metrics like Interest Coverage Ratio, Gross Profit Margin, Dividend Yield, Enterprise Value, and others to create a comprehensive financial profile. By translating complex financial data into easily digestible color-coded indicators, traders can quickly understand a company's financial strengths and potential risks without deep accounting knowledge.
Why it may be useful
Financial metrics are crucial for understanding a company's underlying health, performance, and potential investment value beyond simple price movements. By providing a holistic view of financial indicators, traders and investors can make more informed decisions about potential investments, understanding the company's profitability, efficiency, and risk levels.
These metrics help investors evaluate a company's financial stability, growth potential, and sustainability. The color-coded system allows even novice investors to quickly identify strengths and weaknesses, enabling faster and more confident investment decisions across various sectors and market conditions.
When to explore it
This indicator is most valuable during fundamental analysis, particularly when considering long-term investments or evaluating companies for swing trading strategies. It is especially useful when comparing companies within the same industry or assessing a company's financial evolution over time.
Investors should leverage this tool during earnings reports, when considering portfolio diversification, or when exploring new investment opportunities. The comprehensive nature of the metrics makes it particularly helpful for value investors, dividend seekers, and those interested in understanding a company's financial mechanics beyond surface-level price movements.
Keep exploring
What we’ve verified
Access, alerts and repainting behaviour have not been independently verified for this indicator. Check the creator’s current publication and settings.
General descriptions and classifications are recovered research. Verified details above identify the specific checks we have completed. Check the creator’s current publication for later changes.