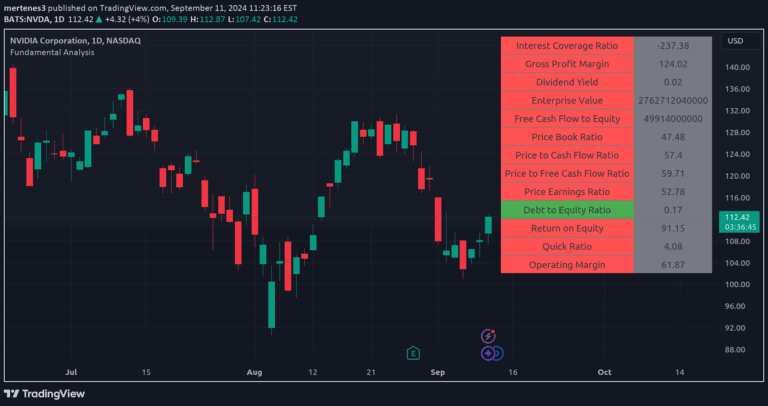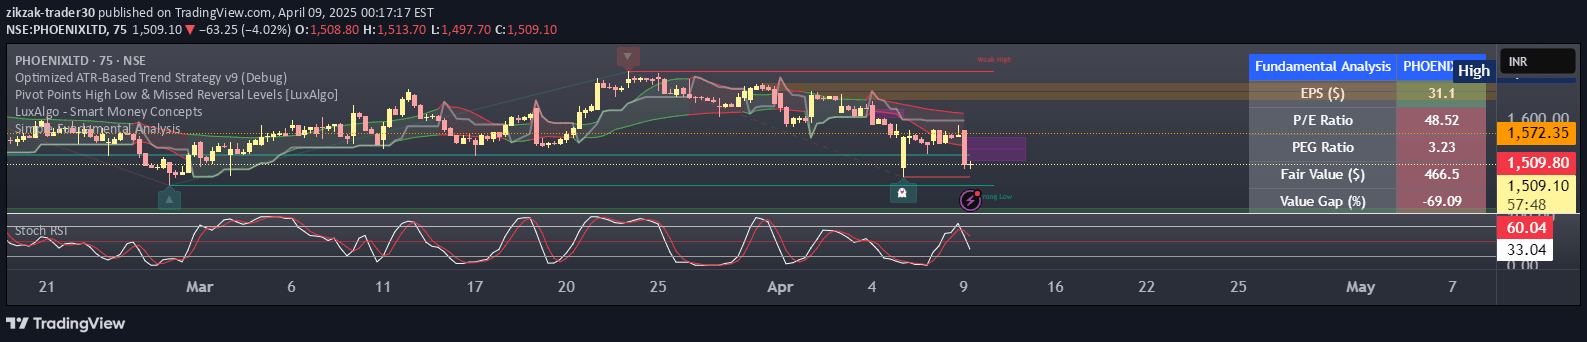
A comprehensive fundamental analysis tool that calculates financial metrics, generates fair value estimates, and provides color-coded buy/sell signals based on a company's financial health.
Explore complementary indicator rolesHow it works
The fundamental analysis signal operates by aggregating 14 key financial metrics like EPS, P/E Ratio, and PEG Ratio into a comprehensive evaluation. It calculates a fair value estimate by multiplying the standard PE ratio (typically 15) with the company's earnings per share to determine potential under or overvaluation.
The tool then generates color-coded signals based on these metrics, with green indicating healthy financial indicators and red highlighting potentially concerning areas. An overall percentage rating is produced to show the strength of the buy, sell, or neutral recommendation, providing traders with a quick snapshot of a company's fundamental financial condition.
Why it may be useful
Fundamental analysis provides critical insights beyond technical indicators, helping investors understand a company's true financial health and potential value. By examining multiple financial metrics simultaneously, traders can make more informed decisions about potential investment opportunities.
The color-coded system and percentage rating simplify complex financial data, allowing both experienced and novice investors to quickly assess a stock's fundamental strength. This approach helps identify potentially undervalued stocks and mitigate investment risks by providing a comprehensive view of a company's financial performance.
When to explore it
This fundamental analysis signal is most effective for value investors and long-term traders seeking to identify fundamentally sound companies trading at attractive prices. It works best when used as part of a comprehensive investment strategy that combines both fundamental and technical analysis.
The tool is particularly useful during market transitions, earnings seasons, or when evaluating stocks in stable, mature industries where traditional valuation metrics hold more significance. Investors should use this signal as a starting point for further research, not as a standalone decision-making tool.
Keep exploring
What we’ve verified
Access, alerts and repainting behaviour have not been independently verified for this indicator. Check the creator’s current publication and settings.
General descriptions and classifications are recovered research. Verified details above identify the specific checks we have completed. Check the creator’s current publication for later changes.