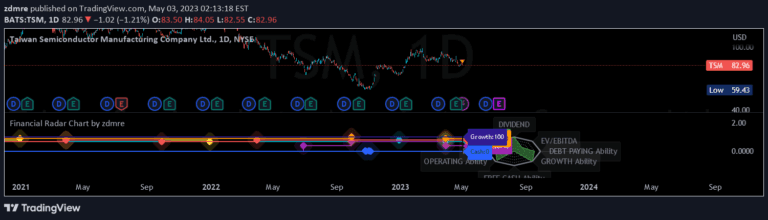
An indicator that compares free cashflow per share with dividend per share, helping investors assess a company's ability to sustain dividend payments through operational cash generation.
Explore complementary indicator rolesHow it works
The indicator calculates free cashflow per share by analyzing the company's cash generated from core business operations over a 12-month period. It then directly compares this value against the dividend per share to provide a clear financial health metric.
By examining the ratio between operational cash generation and dividend payments, investors can understand whether a company has sufficient internal resources to maintain its dividend commitments without relying on external financing or potentially unsustainable practices.
Why it may be useful
This signal is crucial for income-focused investors seeking stable and sustainable dividend investments. It provides a quick, transparent assessment of a company's dividend sustainability by showing whether generated cash can naturally cover dividend distributions.
Investors can use this metric to identify companies with robust financial structures, reducing the risk of unexpected dividend cuts or financial instability. It offers a forward-looking perspective on a company's ability to maintain shareholder returns.
When to explore it
The indicator works best when analyzing stable, mature companies with consistent cash flows and established dividend policies. It is particularly useful during economic cycles where financial stability becomes paramount for investment decisions.
Investors should preferably use this metric alongside other financial indicators and consider the specific industry context, as cash flow patterns can vary significantly across different business sectors and economic environments.
Keep exploring
What we’ve verified
Access, alerts and repainting behaviour have not been independently verified for this indicator. Check the creator’s current publication and settings.
General descriptions and classifications are recovered research. Verified details above identify the specific checks we have completed. Check the creator’s current publication for later changes.