YOUR INDICATOR RESEARCH STARTS HERE

Find the right indicator.
Understand what it does.

Explore 11,183 indicators. Filter beyond the obvious.
Discover the tools that fit the way you trade.

THE INDICATOR LIBRARY

Results for “income”

11,183 tools to explore

43 indicators matching your filters
Save search
Editor’s pick

Financials on Chart

by TradingView

A comprehensive financial indicator that displays up to 9 fundamental metrics from income statements, balance sheets, cash flow, and financial statistics directly on your trading chart.

Main price chart · unverifiedDay Trading · Swing Trading
Explore
2.4Klikes50.9Kviews49comments
Save
TrendMomentumEditor’s pick

Financial Growth

by morzor61

A financial analysis tool that compares quarterly, annual, and TTM performance metrics, providing comprehensive insights into company growth through various financial indicators and visualization options.

Separate pane · unverifiedSwing Trading
Explore
1.3Klikes35.5Kviews63comments
Save
VolumeTrendEditor’s pick

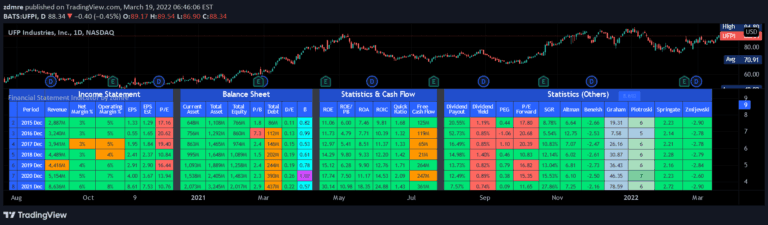
Financial Statement Indicator by zdmre

by zdmre

A comprehensive financial analysis tool that combines key financial statement metrics to assess a company's financial health, performance, and investment potential across income, balance sheet, and cash flow dimensions.

Separate pane · unverifiedSwing Trading
Explore
754likes23.8Kviews28comments
Save
IncomeSignalEditor’s pick

Dividend Calendar (Zeiierman)

by Zeiierman

A comprehensive dividend tracking tool that helps investors analyze dividend payouts, forecast income, and make strategic investment decisions across various stocks and sectors.

Separate pane · unverifiedDay Trading · Swing Trading
Explore
625likes47.8Kviews22comments
Save
TrendMomentumEditor’s pick

BEST Dollar Cost Average

by Daveatt

Dollar-Cost Averaging (DCA) indicator that compares investing a fixed amount periodically versus a lump sum investment, helping traders analyze long-term investment strategies across different timeframes.

Separate pane · unverifiedSwing Trading
Explore
593likes20Kviews12comments
Save
VolumeEditor’s pick

Earnings, Splits, Dividends

by MichelT

A Pine Script method for retrieving financial event data like earnings reports, stock splits, and dividend information using TradingView's inner data representation system.

Main price chart · unverifiedDay Trading · Swing Trading
Explore
416likes14.9Kviews19comments
Save
SignalTrend

Total Return

by uzair67324

A comprehensive index tracking total stock performance by combining price changes and dividend returns, offering investors a complete view of investment performance over time.

Separate pane · unverifiedSwing Trading
Explore
120likes3.7Kviews2comments
Save
Signal

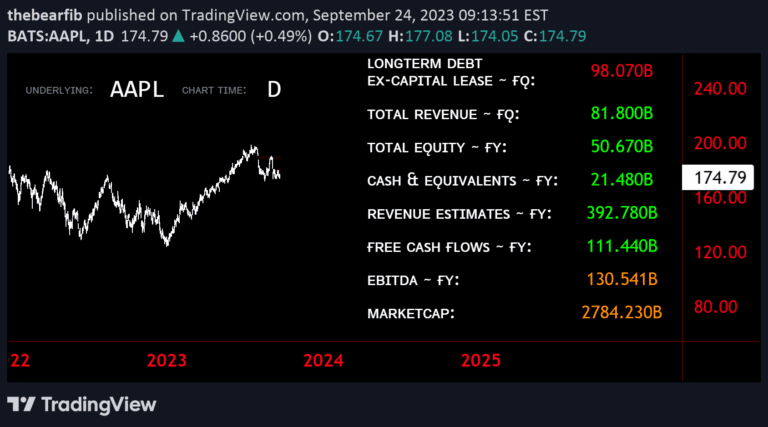
BearMetrics

by thebearfib

Financial health analysis provides crucial insights into a company's ability to generate profits, manage risks, and sustain long-term operations through comprehensive evaluation of financial statements.

Separate pane · unverifiedSwing Trading
Explore
50likes1.3Kviews0comments
Save
LevelsSignalTrend

JPMorgan Collar Levels

by kksg999

JPMorgan Collar Levels track quarterly institutional positioning for SPX/SPY, providing strategic resistance and support zones for traders to monitor market dynamics.

Main price chart · unverifiedSwing Trading
Explore
47likes1.5Kviews1comments
Save

Likes, views, and comments are historical TradingView snapshots. They describe attention, not trading performance.

START WITH A QUESTION

A little less searching.
A lot more understanding.

Tell DeepAlpha what you need. Get an explanation, a shortlist,
and a direct path to the indicators behind it.

Ask DeepAlpha