sᴛᴀɢᴇ ᴀɴᴀʏʟsɪs
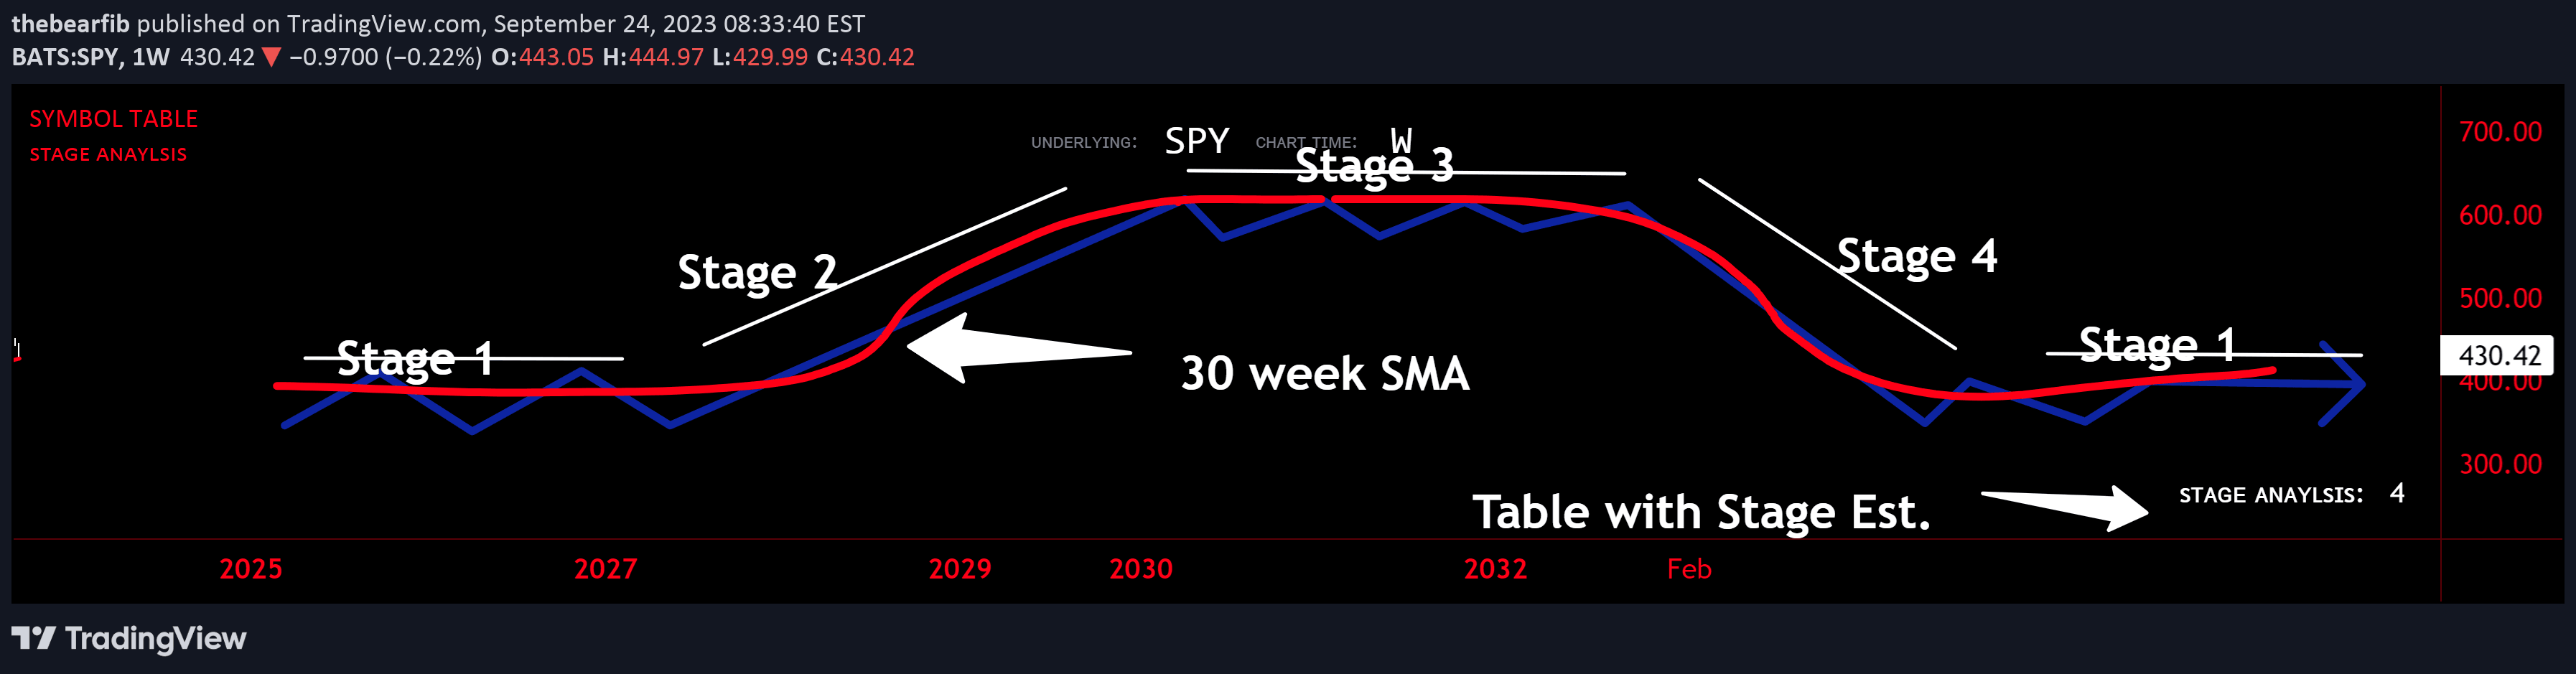
Stage analysis is a technical approach categorizing stock price movements into four stages to help traders identify trend direction, potential reversals, and optimal entry/exit points.
Explore 11,183 indicators. Filter beyond the obvious.
Discover the tools that fit the way you trade.
11,183 tools to explore
Stage analysis is a technical approach categorizing stock price movements into four stages to help traders identify trend direction, potential reversals, and optimal entry/exit points.
Volume Profile is a technical analysis tool that visualizes trading volume across different price levels, helping traders identify key support, resistance, and trading activity zones.
A dynamic Volume Weighted Average Price (VWAP) indicator that calculates and plots VWAP lines for current and previous trading days with customizable settings.
A MACD-based trading indicator that provides customizable bullish and bearish signals using triangular markers and multiple trigger conditions for precise entry and exit points.
LBR-Bars is a complex TradingView indicator that uses Keltner channels and volatility lines to provide visual cues about market conditions and potential trading opportunities.
A multi-timeframe MACD indicator that helps traders analyze market trends by tracking moving average convergence divergence across different time periods with customizable settings.
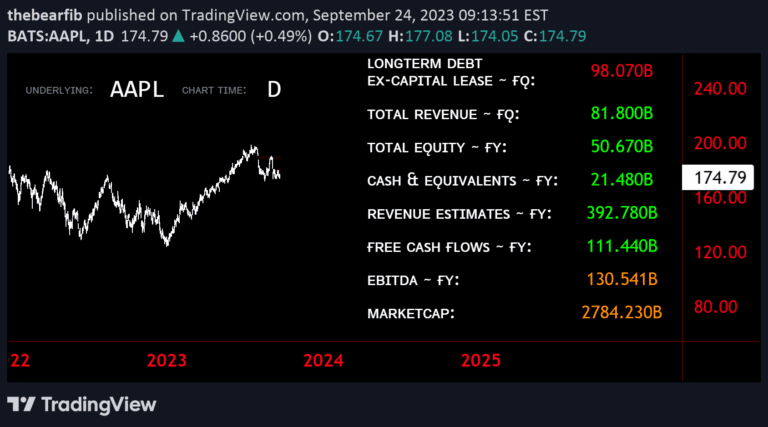
Financial health analysis provides crucial insights into a company's ability to generate profits, manage risks, and sustain long-term operations through comprehensive evaluation of financial statements.
A comprehensive overview of the NYSE trading day structure, highlighting the different trading sessions and their specific characteristics throughout the day.
Likes, views, and comments are historical TradingView snapshots. They describe attention, not trading performance.