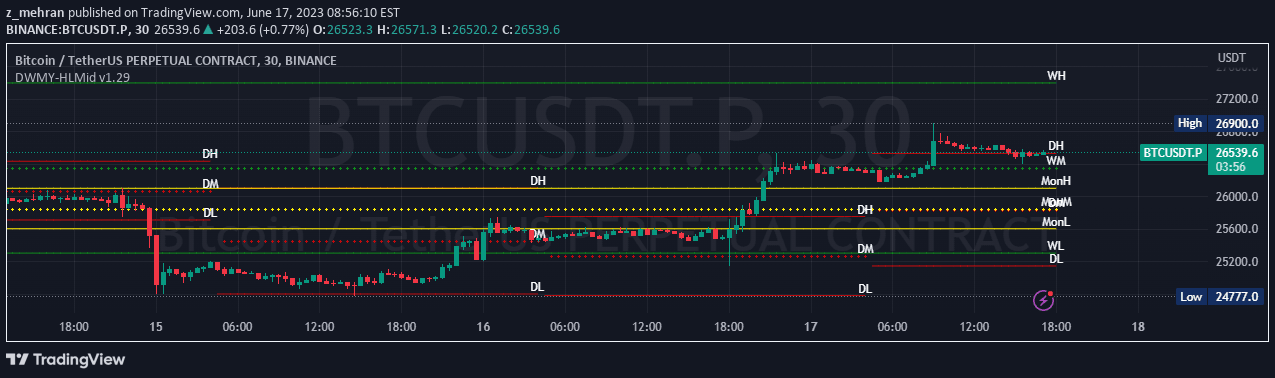
Automated tool for identifying daily, weekly, and monthly reversal levels, providing instant support and resistance lines across different timeframes for technical analysis.
Explore complementary indicator rolesHow it works
The indicator scans daily, weekly, and monthly timeframes to identify reversal candles and automatically draw horizontal levels from their opening points. It intelligently filters and manages these levels, ensuring that only significant reversal points are marked on the chart.
The system checks each new bar to determine whether existing levels should be maintained or removed, with specific rules about level persistence. Levels are only displayed on equal or lower timeframes, and new levels are prevented from being drawn if they are too close to existing ones.
Why it may be useful
Traders need quick and accurate identification of potential support and resistance zones to make informed trading decisions. This indicator eliminates the manual process of drawing levels, saving time and reducing human error in technical analysis.
By providing automated, dynamic level tracking across multiple timeframes, traders can quickly visualize key price interaction points. The tool helps traders understand potential reversal zones and improve their entry, exit, and risk management strategies.
When to explore it
This indicator is most effective when traders want to quickly identify potential support and resistance levels across different market timeframes. It works best in markets with clear trending or ranging characteristics, where price tends to respect historical reversal points.
Traders should utilize this tool when analyzing charts across various timeframes, from intraday to longer-term perspectives. It is particularly useful for confirming potential trade setups, identifying key price zones, and understanding the broader market structure.
Keep exploring
What we’ve verified
Access, alerts and repainting behaviour have not been independently verified for this indicator. Check the creator’s current publication and settings.
General descriptions and classifications are recovered research. Verified details above identify the specific checks we have completed. Check the creator’s current publication for later changes.