Weekly Volume Heatmap
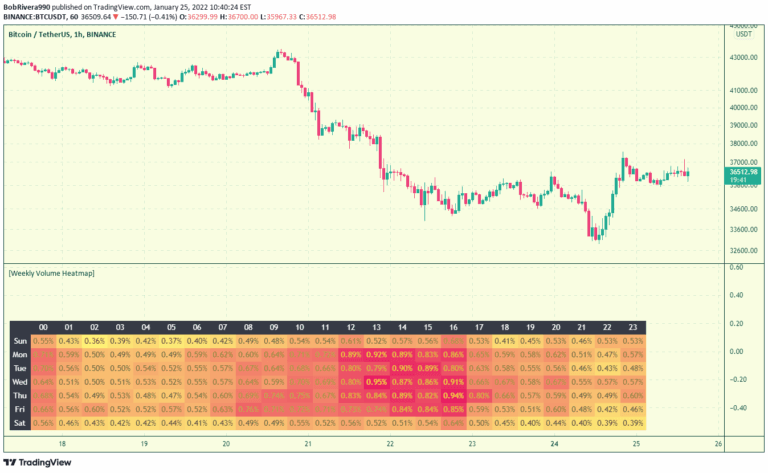
A trading tool that visualizes asset trading volume variations across different times of the week, helping traders understand market liquidity and optimal trading periods.
Explore 11,183 indicators. Filter beyond the obvious.
Discover the tools that fit the way you trade.
11,183 tools to explore
A trading tool that visualizes asset trading volume variations across different times of the week, helping traders understand market liquidity and optimal trading periods.
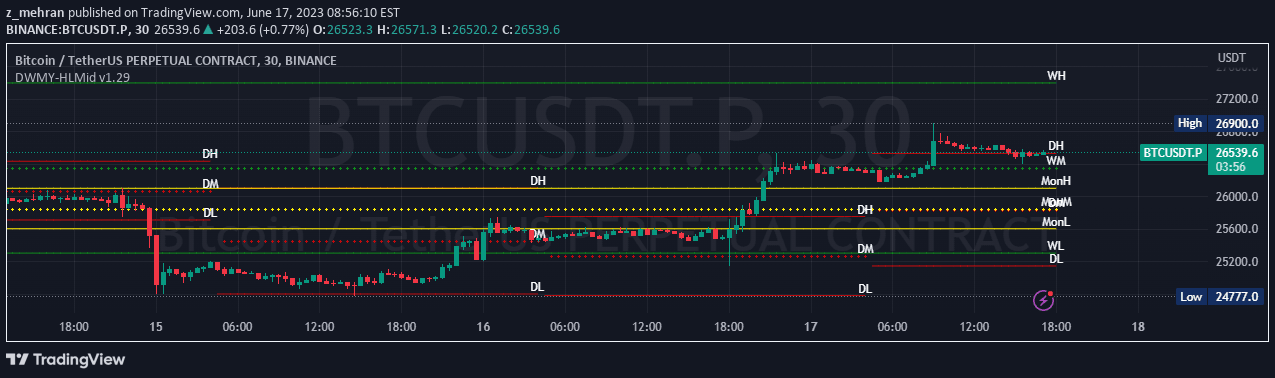
A comprehensive price level indicator that tracks daily, weekly, monthly, quarterly, and yearly high, mid, and low values to help traders analyze market movements and identify key support and resistance levels.
A trading signal that analyzes price ranges using statistical measures, tracking defining range (DR) and projection levels to predict potential price movements and market behavior.
CME Bitcoin Futures gap identification tool that tracks price disparities during market closures, helping traders recognize potential price reversion opportunities.
A weekly horizontal line indicator providing potential market sentiment by plotting a color-coded reference line at 12am EST on Monday for forex markets.
A specialized trading tool that identifies and visualizes price gaps in cryptocurrency markets, focusing on weekend trading sessions and potential price movements.
A visual projection tool that helps traders anticipate market structure by plotting forward-looking weekly and daily boxes to frame potential price movement and market profile.
A trading strategy that tracks the high and low prices from Monday's session to provide a reference point for price action and potential market dynamics throughout the week.
A technical tool tracking weekly price gaps in XAUUSD, revealing market sentiment and potential trading opportunities by analyzing the weekend price difference.
A Monday trading range indicator that calculates and highlights the lowest and highest prices during a specific trading session, with customizable time and day settings.
A trading script that highlights specific 7-hour market windows, tracking price ranges and identifying potential momentum breakout opportunities during key market hours.
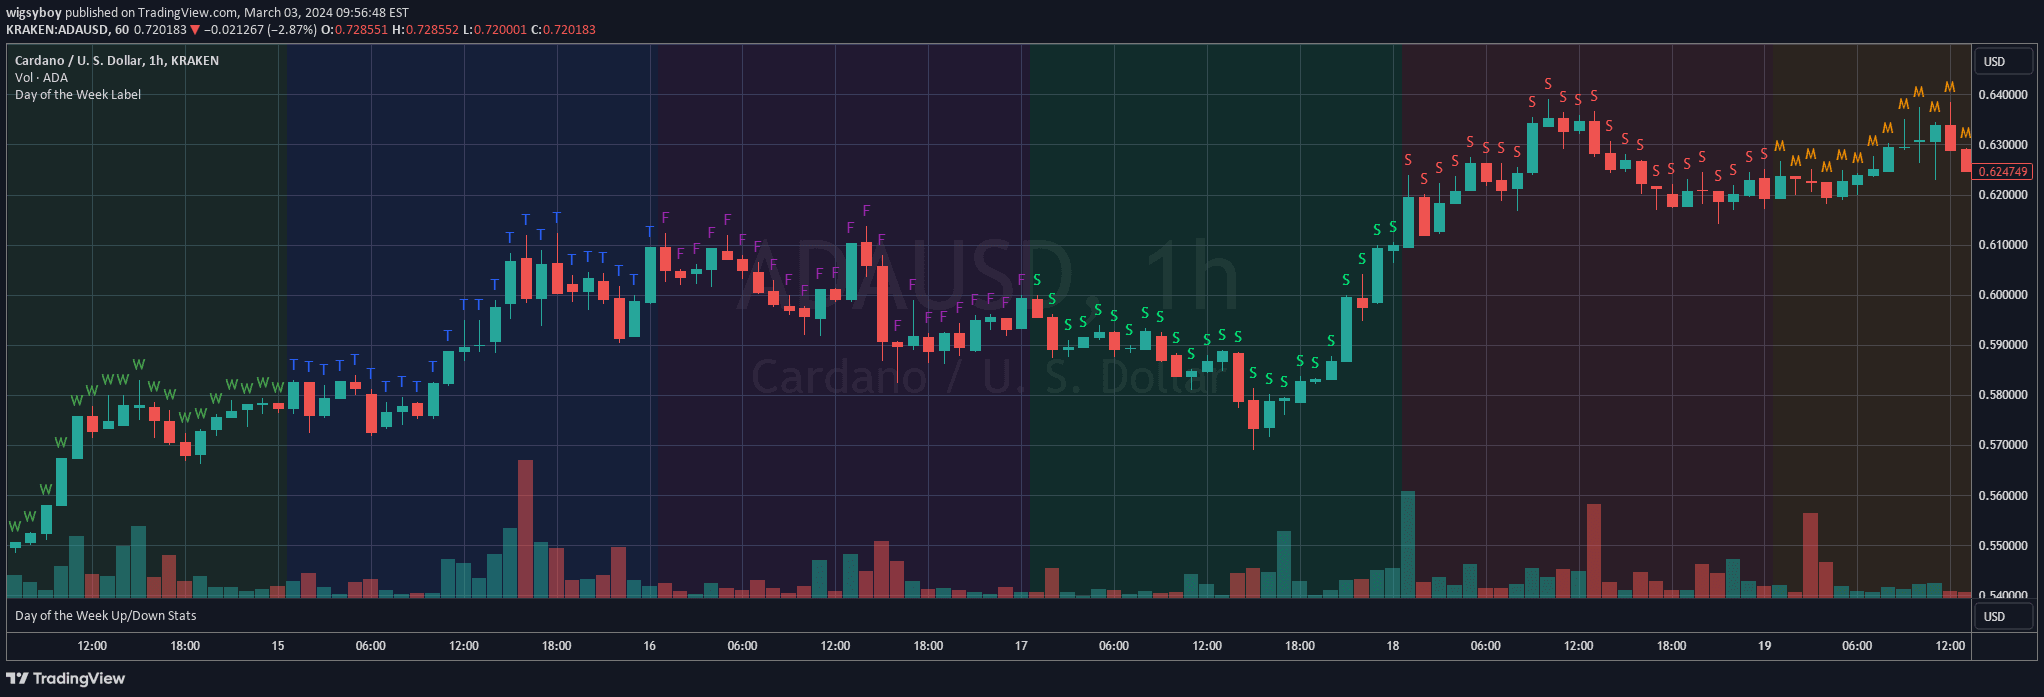
A TradingView chart overlay that adds day of the week labels to candlesticks, helping traders quickly identify and analyze daily trading patterns.
Likes, views, and comments are historical TradingView snapshots. They describe attention, not trading performance.