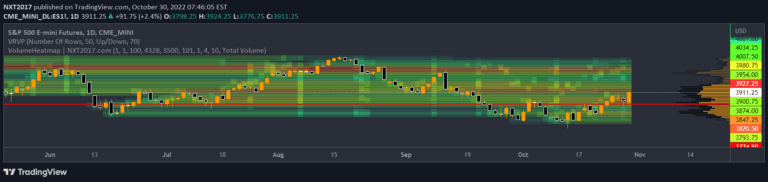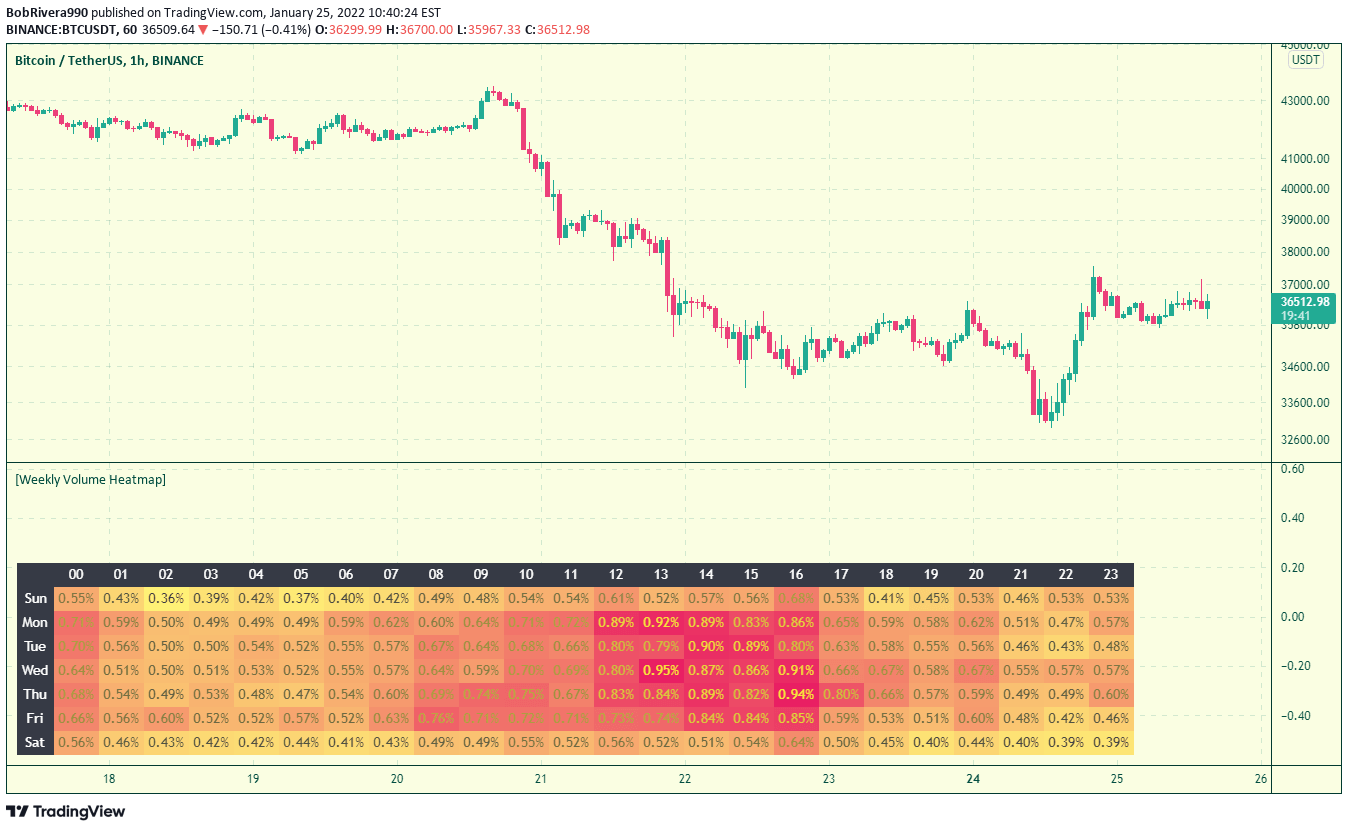
A trading tool that visualizes asset trading volume variations across different times of the week, helping traders understand market liquidity and optimal trading periods.
Explore complementary indicator rolesHow it works
This signal calculates the average traded volume for each specific time period, such as Monday at 9:00 AM, across all available historical bars. It then compares each period's average volume to the overall weekly average volume, expressing the result as a percentage.
The percentage is color-coded, with lighter colors representing lower volumes and darker colors indicating higher trading volumes, providing a visual representation of trading activity throughout the week
Why it may be useful
Understanding trading volume variations can help traders make more informed decisions by revealing periods of market liquidity and potential manipulation. Low-volume periods are more susceptible to price manipulation by large traders, while high-volume periods suggest more active market participation.
By identifying these volume patterns, traders can avoid potential stop-hunting scenarios, reduce trading risks, and choose times with more reliable price movements and market conviction
When to explore it
This signal is most effective during day trading and swing trading scenarios where understanding market dynamics is crucial. It works best when applied to hourly timeframes and across different asset classes like stocks, futures, and forex.
Traders should use this tool to avoid trading during low-volume periods, which are more prone to market manipulation. It's particularly useful for identifying optimal times to enter or exit trades and for avoiding potential stop-loss hunting scenarios
Keep exploring
What we’ve verified
Access, alerts and repainting behaviour have not been independently verified for this indicator. Check the creator’s current publication and settings.
General descriptions and classifications are recovered research. Verified details above identify the specific checks we have completed. Check the creator’s current publication for later changes.