
YOUR INDICATOR RESEARCH STARTS HERE

Find the right indicator.
Understand what it does.

Explore 11,183 indicators. Filter beyond the obvious.
Discover the tools that fit the way you trade.

THE INDICATOR LIBRARY

Results for “stophunt”

11,183 tools to explore

9 indicators matching your filters
Save search
LevelsSignal

Liquidity Sweeps and Raids

by Cancamurria

A trading script that calculates and tracks liquidity levels through price raids and sweeps, helping traders identify potential market reactions and reversals based on liquidity insights.

Main price chart · unverifiedScalping · Day Trading
Explore
1.6Klikes54.5Kviews131comments
Save
VolumeEditor’s pick

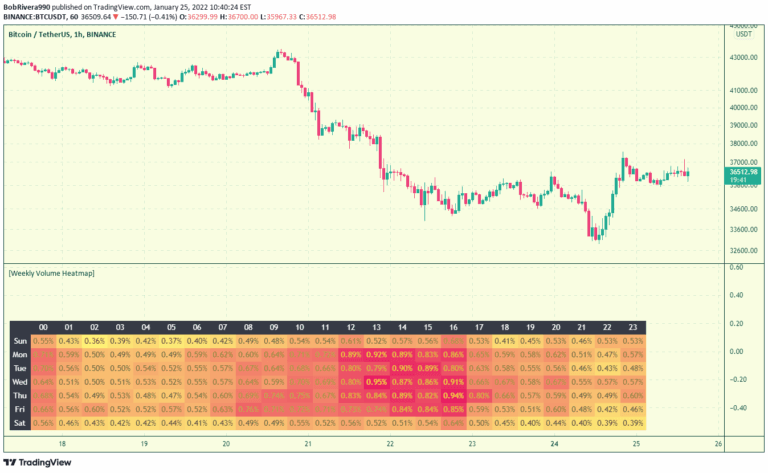
Weekly Volume Heatmap

by BobRivera990

A trading tool that visualizes asset trading volume variations across different times of the week, helping traders understand market liquidity and optimal trading periods.

Separate pane · unverifiedDay Trading · Swing Trading
Explore
1.2Klikes52.9Kviews41comments
Save
LevelsSignal

Stop Hunts [MK]

by malk1903

A trading indicator that identifies liquidity zones around previous high and low points, helping traders spot potential market reversals and entry/exit points.

Main price chart · unverifiedScalping · Day Trading
Explore
400likes8.4Kviews4comments
Save
SignalVolatility

Stophunt Wick

by KiLA-WHALE

A trading signal that identifies liquidity raids and stop-hunt moments in price action, highlighting rapid price movements and potential trend reversals through wick and candle analysis.

Main price chart · unverifiedScalping · Day Trading
Explore
356likes8.1Kviews9comments
Save
LevelsSignalTrend

SMA Fibonacci Rainbow Waves[FibonacciFlux]

by FibonacciFlux

An advanced trading indicator using multiple Simple Moving Averages weighted by Fibonacci principles to identify market trends, support/resistance levels, and potential trading opportunities across various timeframes.

Main price chart · unverifiedScalping · Day Trading
Explore
197likes3.6Kviews0comments
Save
LevelsSignal

Custom Price Levels and Averages

by drmch2020

A dynamic indicator that calculates and displays key price levels and average prices based on user-defined parameters, helping traders identify potential support and resistance zones.

Main price chart · unverifiedScalping · Day Trading
Explore
34likes2.1Kviews0comments
Save

Likes, views, and comments are historical TradingView snapshots. They describe attention, not trading performance.

START WITH A QUESTION

A little less searching.
A lot more understanding.

Tell DeepAlpha what you need. Get an explanation, a shortlist,
and a direct path to the indicators behind it.

Ask DeepAlpha