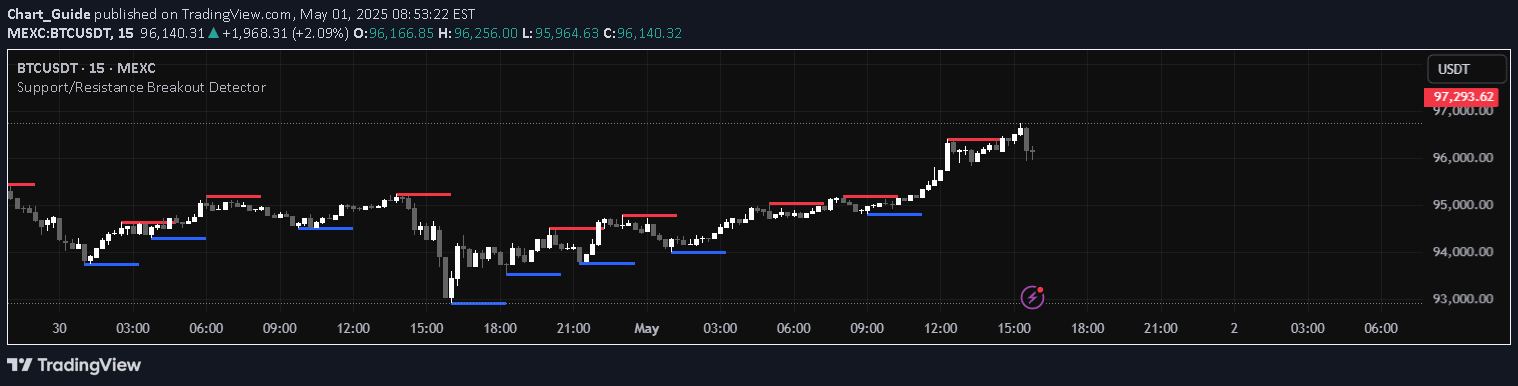
An advanced trading indicator using multiple Simple Moving Averages weighted by Fibonacci principles to identify market trends, support/resistance levels, and potential trading opportunities across various timeframes.
Explore complementary indicator rolesHow it works
The SMA Fibonacci Rainbow Waves indicator works by calculating multiple Simple Moving Averages (SMAs) using Fibonacci number weightings, creating a dynamic, colorful representation of price action. Each SMA is assigned a different color and represents a specific trend layer, from short-term to long-term market movements.
By applying Fibonacci principles to these moving averages, the indicator creates sophisticated support and resistance levels that adapt to changing market conditions. The colored SMAs interact with each other, generating visual signals when price crosses or consolidates around these dynamic levels, helping traders identify potential entry and exit points.
Why it may be useful
This indicator provides traders with a comprehensive view of market dynamics by blending multiple trend indicators into a single, visually intuitive tool. It helps traders cut through market noise by presenting clear trend information across different timeframes, allowing for more informed decision-making and reduced emotional trading.
The Fibonacci-weighted approach adds mathematical precision to trend analysis, enabling traders to anticipate potential market movements with greater accuracy. By offering insights into support and resistance levels, the indicator helps traders manage risk more effectively and identify high-probability trading opportunities.
When to explore it
The SMA Fibonacci Rainbow Waves indicator is most effective in trending markets where price is showing clear directional movement across multiple timeframes. It works exceptionally well in liquid markets with consistent price action, such as major forex pairs, stock indices, and high-volume cryptocurrencies.
Traders should primarily use this indicator during periods of stable market conditions, avoiding its application during extreme volatility or major economic announcements. It is particularly useful for confirming trend strength, identifying potential reversal zones, and generating precise entry and exit signals across scalping, day trading, and swing trading strategies.
Keep exploring
What we’ve verified
Access, alerts and repainting behaviour have not been independently verified for this indicator. Check the creator’s current publication and settings.
General descriptions and classifications are recovered research. Verified details above identify the specific checks we have completed. Check the creator’s current publication for later changes.