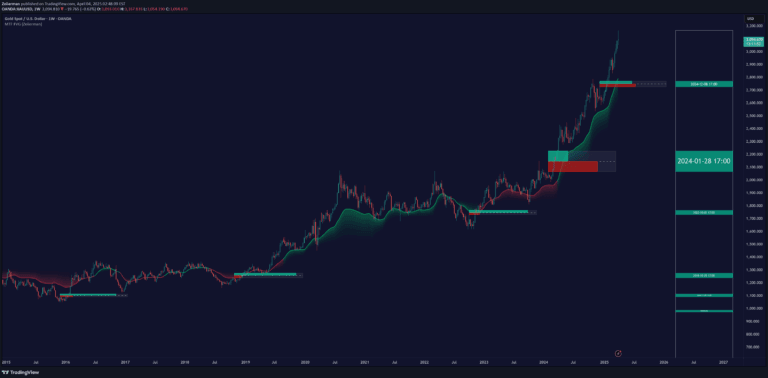
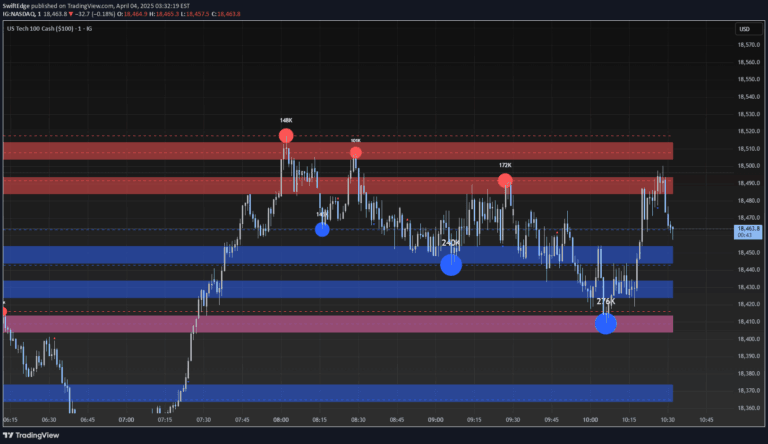
An indicator analyzing liquidity engulfing candles across multiple timeframes, revealing potential market structure breaks and displacement opportunities using ICT trading principles.
Explore complementary indicator rolesHow it works
The liquidity engulfing candles indicator operates by tracking candlestick patterns across multiple timeframes like H1 and H4, identifying potential stop hunt and market structure break opportunities. It analyzes candlestick relationships, looking for specific engulfing patterns that suggest significant market movements and liquidity shifts.
The displacement component examines price movements by calculating standard deviation and detecting strong directional changes. By comparing open/close or high/low values, the indicator can highlight significant price displacements and potential Fair Value Gap (FVG) formations, providing traders with insights into market dynamics and potential entry points.
Why it may be useful
This indicator is crucial for traders seeking to understand market microstructure and liquidity dynamics across different timeframes. By revealing potential stop hunt scenarios and market structure breaks, it helps traders identify high-probability trading opportunities that traditional indicators might miss.
The displacement and FVG detection mechanisms provide traders with advanced insights into price movement characteristics, enabling more precise entry and exit strategies. Its multi-timeframe analysis allows traders to align their understanding of market movements from different perspectives, potentially improving trade decision-making and risk management.
When to explore it
The liquidity engulfing candles indicator is most effective in volatile market conditions where significant price movements and liquidity shifts are likely to occur. It works best in markets with clear trend structures, such as forex, crypto, and major stock indices, where market microstructure plays a critical role in price discovery.
Traders should utilize this indicator during key market sessions, such as overlap periods between major financial centers or during significant economic news releases. It is particularly useful for traders following ICT (Inner Circle Trader) methodologies and those interested in understanding the underlying mechanics of price movement beyond traditional technical analysis.
Keep exploring
What we’ve verified
Access, alerts and repainting behaviour have not been independently verified for this indicator. Check the creator’s current publication and settings.
General descriptions and classifications are recovered research. Verified details above identify the specific checks we have completed. Check the creator’s current publication for later changes.