Quarterly Earnings
A TradingView script that displays quarterly earnings per share and sales data with year-on-year percentage changes, offering customizable visualization of financial performance metrics.
Explore 11,183 indicators. Filter beyond the obvious.
Discover the tools that fit the way you trade.
11,183 tools to explore
A TradingView script that displays quarterly earnings per share and sales data with year-on-year percentage changes, offering customizable visualization of financial performance metrics.
The Commitment of Traders (COT) report analyzes market positions of commercial, large, and small traders to provide strategic trading insights and market sentiment.
A specialized price tracking indicator displaying previous day, week, and month's high and low price levels, adaptable across different timeframes to help traders identify key historical price reference points.
A customizable higher time-frame OHLC indicator that provides flexible visual references across multiple resolutions with advanced input options and alert conditions.
A seasonality indicator that analyzes an asset's historical performance across daily, monthly, and quarterly timeframes, revealing patterns of market behavior throughout the year.
A comprehensive trading script that recreates TradingView's watchlist stats panel, offering real-time performance metrics and historical comparisons across multiple timeframes.
A financial analysis tool that compares quarterly, annual, and TTM performance metrics, providing comprehensive insights into company growth through various financial indicators and visualization options.
A trading signal that analyzes short volume, total volume, and short volume ratio since the 2-year high price, providing insights into market sentiment and potential trend shifts.
A dynamic support and resistance indicator using price binning to group price action into 10 ranges, identifying consolidation zones and potential market turning points.
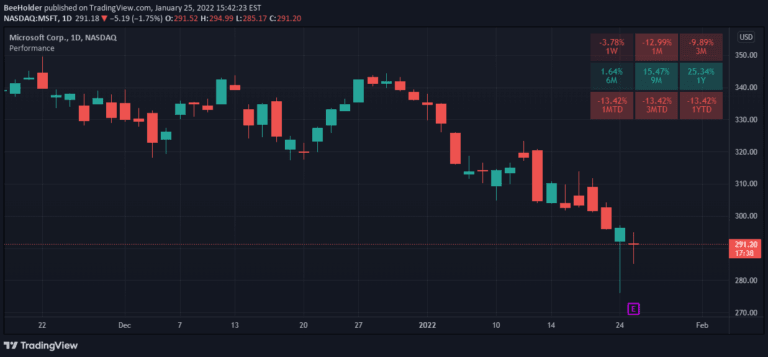
A performance indicator that compares current price to past prices, calculating returns over different time periods like 1 week, 1 month, and 1 year to track symbol performance.
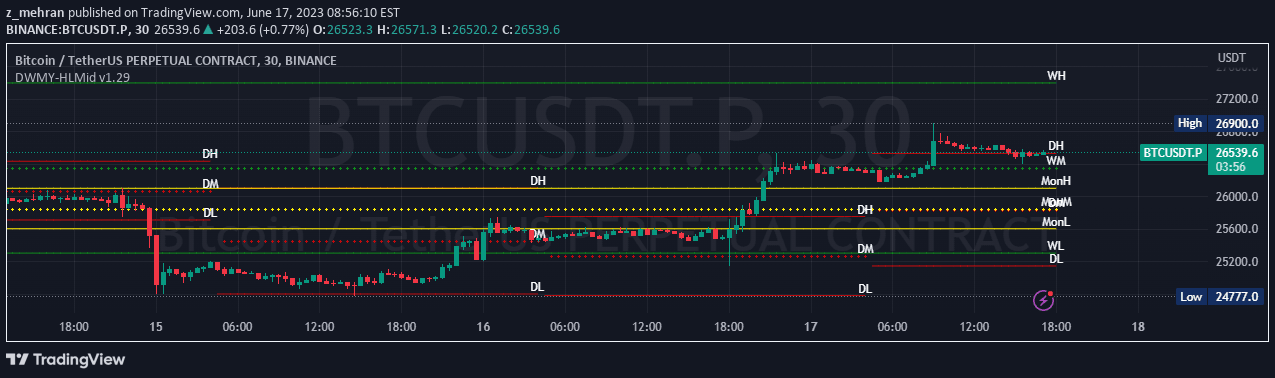
A comprehensive price level indicator that tracks daily, weekly, monthly, quarterly, and yearly high, mid, and low values to help traders analyze market movements and identify key support and resistance levels.
M2 Global Money Supply tracks year-over-year percentage changes in USD money supply across nations, providing insights into monetary expansion and potential economic trends.
Likes, views, and comments are historical TradingView snapshots. They describe attention, not trading performance.