
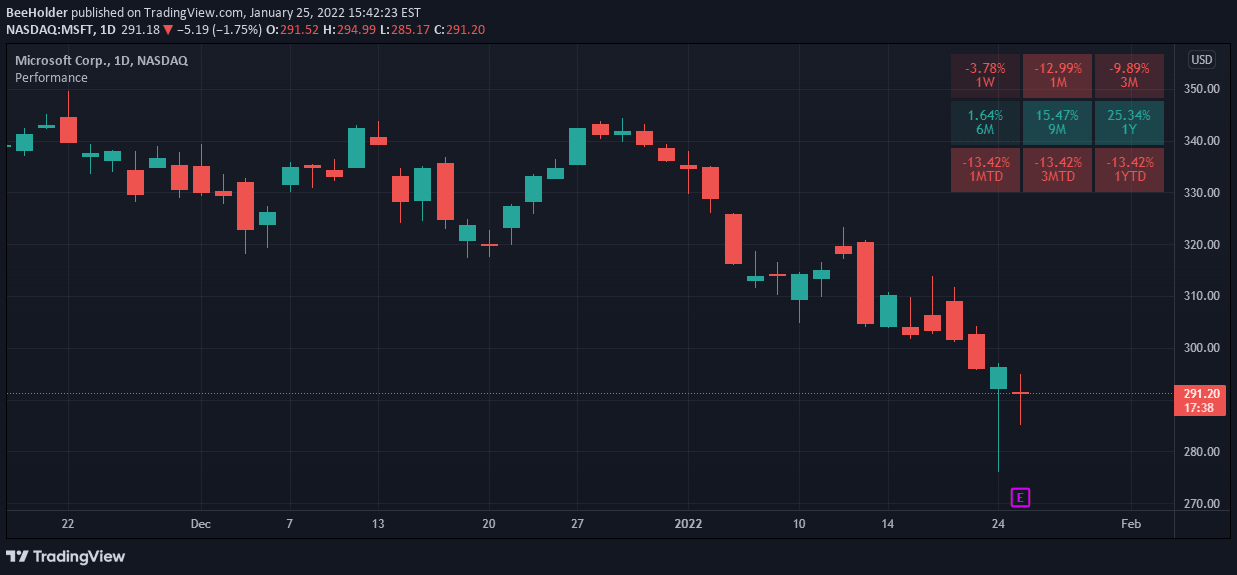
A performance indicator that compares current price to past prices, calculating returns over different time periods like 1 week, 1 month, and 1 year to track symbol performance.
Explore complementary indicator rolesHow it works
The performance indicator calculates percentage returns by comparing the current price to historical prices at specific intervals. It uses predefined lookback periods such as 1 week (5 daily bars), 1 month (21 daily bars), 3 months (63 daily bars), 6 months (126 daily bars), year-to-date, and 1 year (251 daily bars).
The calculation formula involves subtracting the past value from the current value, dividing by the past value, and multiplying by 100 to express the result as a percentage
Why it may be useful
This performance indicator provides traders with a quick and comprehensive view of an asset's historical performance across multiple timeframes. By showing percentage returns, it helps investors assess the potential profitability and historical trend of a symbol.
The indicator allows for rapid comparison of an asset's performance over different periods, enabling more informed investment decisions and providing context for current price movements
When to explore it
This performance indicator is most effective when evaluating long-term investment potential or comparing different assets' historical returns. It works best for investors seeking to understand an asset's past performance across various timeframes.
Traders can use it to identify consistent performers, assess market trends, and make more strategic investment choices. It is particularly useful when analyzing stocks, ETFs, or other financial instruments with substantial historical data
Keep exploring
What we’ve verified
Access, alerts and repainting behaviour have not been independently verified for this indicator. Check the creator’s current publication and settings.
General descriptions and classifications are recovered research. Verified details above identify the specific checks we have completed. Check the creator’s current publication for later changes.


