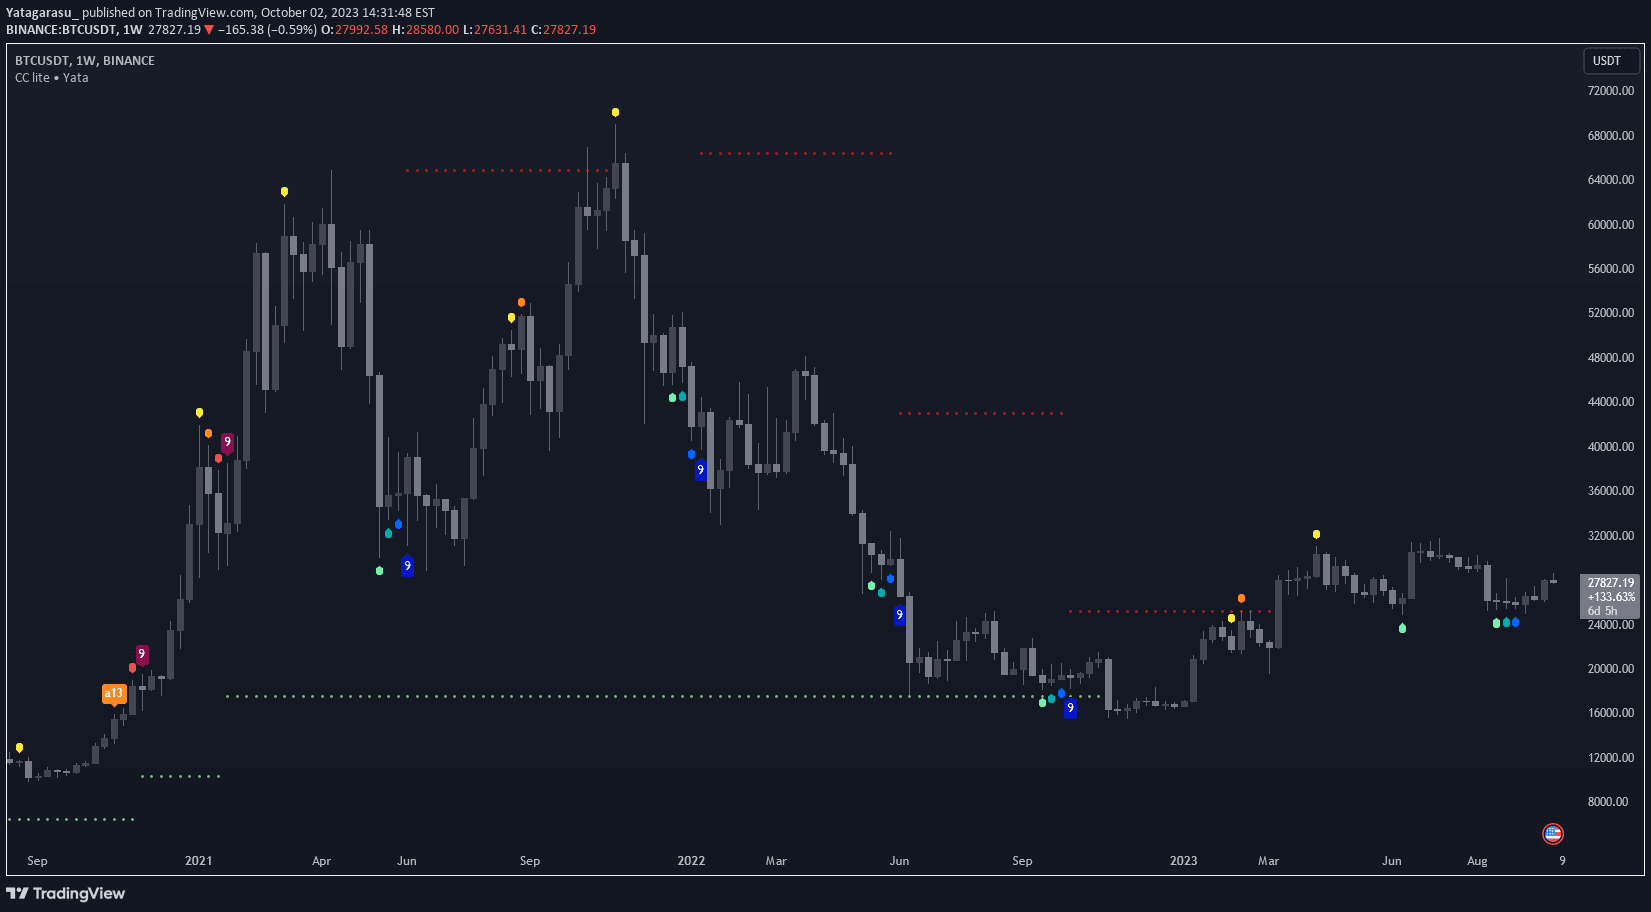
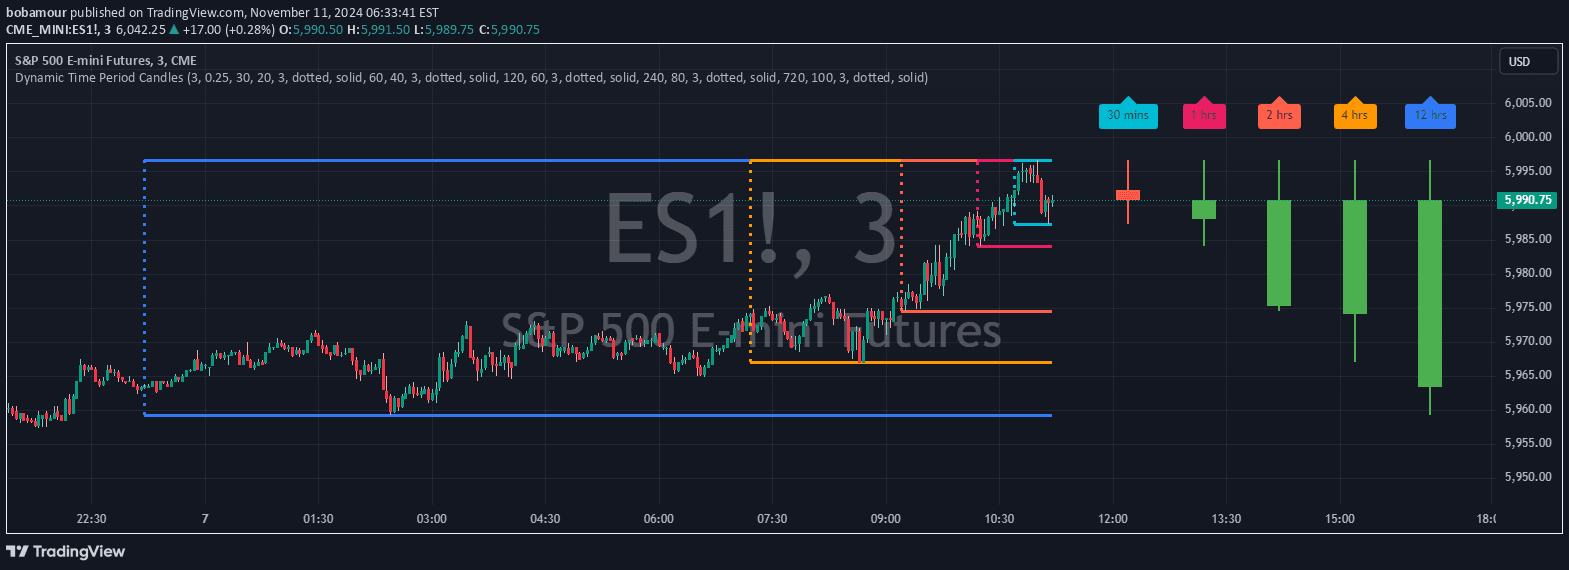
A trading signal that identifies potential turning points in asset prices by highlighting support and resistance levels with customizable display options.
Explore complementary indicator rolesHow it works
The signal works by detecting key price levels where an asset's movement might reverse or pause. Traders can customize the display of these levels, choosing between multiple number representations to reduce visual clutter and enhance readability.
By analyzing historical price action, the indicator plots horizontal or dynamic lines representing potential support and resistance zones. These levels help traders anticipate potential price reversals, breakouts, or consolidation areas, providing critical insights into market dynamics.
Why it may be useful
Support and resistance levels are crucial for understanding market psychology and potential price movements. They represent points where buying or selling pressure has historically been strong, giving traders valuable insights into potential trend changes or continuation.
By providing customizable visualization, the signal allows traders to adapt the indicator to their specific trading style and preferences. This flexibility makes the tool more accessible and useful across different market conditions and trading strategies.
When to explore it
The signal is most effective in markets with clear trending or ranging characteristics, where price tends to respect historical support and resistance levels. It works particularly well in liquid markets with sufficient trading volume and price history.
Traders should use this signal in conjunction with other technical analysis tools to confirm potential entry or exit points. It is especially useful during market transitions, breakouts, or when price approaches known historical levels of interest.
Keep exploring
What we’ve verified
Access, alerts and repainting behaviour have not been independently verified for this indicator. Check the creator’s current publication and settings.
General descriptions and classifications are recovered research. Verified details above identify the specific checks we have completed. Check the creator’s current publication for later changes.