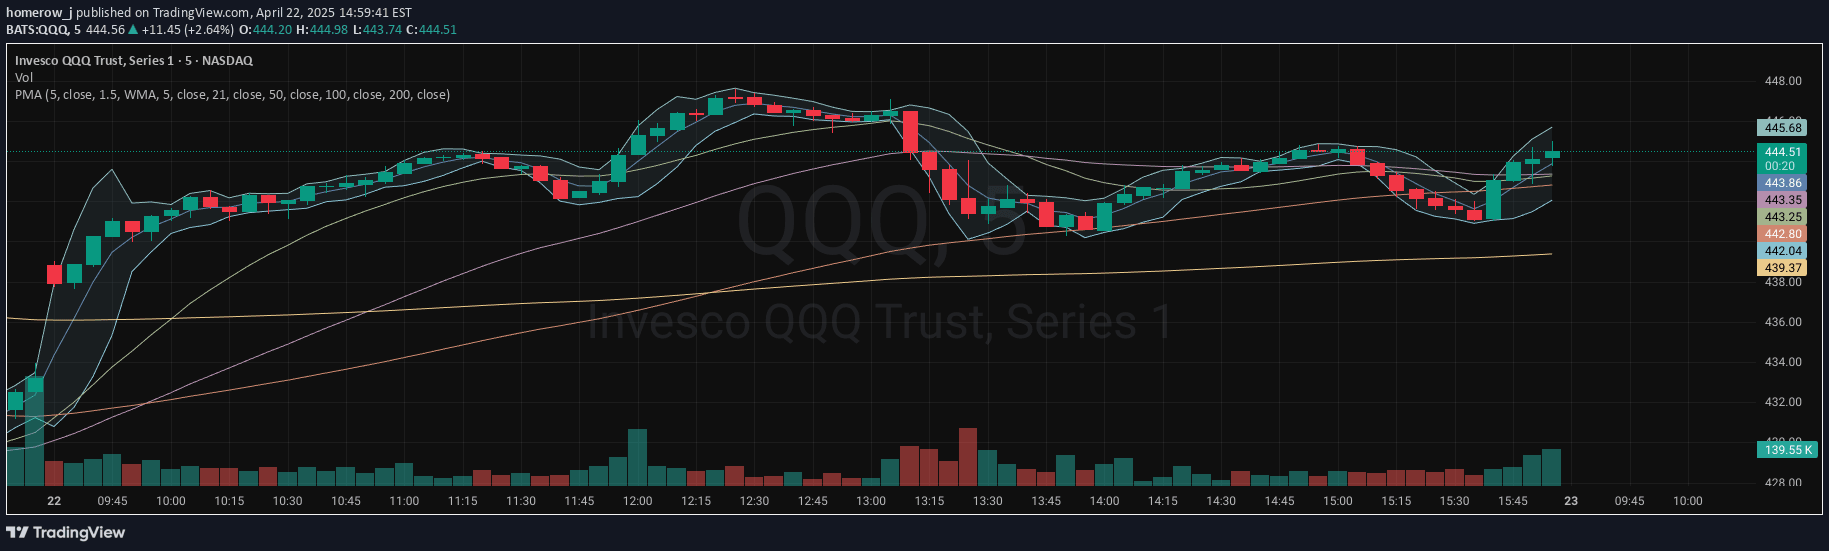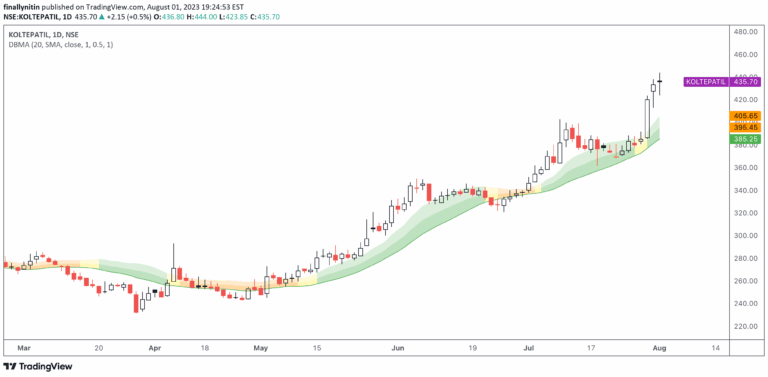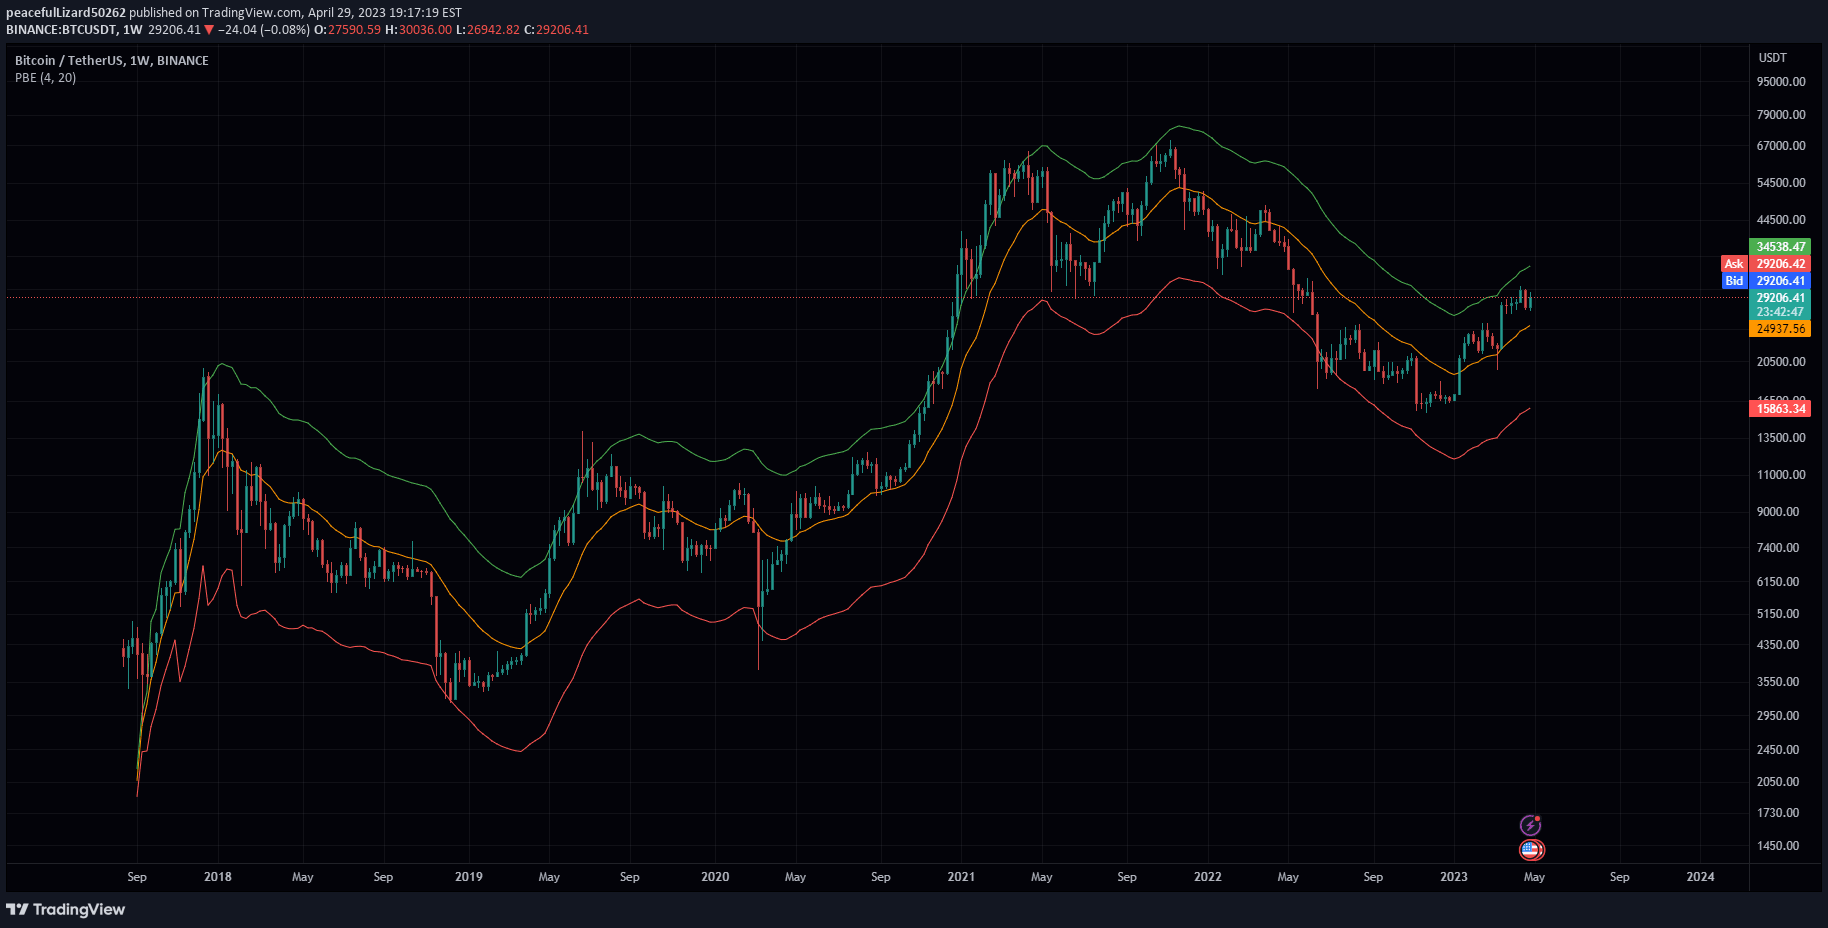
A probability-based technical analysis indicator that calculates potential price movements using statistical methods, creating dynamic envelopes around current price to predict potential support and resistance levels.
Explore complementary indicator rolesHow it works
The Probability Envelopes Indicator operates by analyzing historical price movements and categorizing them into bullish and bearish scenarios. It calculates probabilities of price movements by examining their frequency and creating a weighted average of expected green and red movements.
Using advanced statistical techniques like mean, variance, and standard deviation, the indicator constructs upper and lower bands around the current price. These bands are dynamically adjusted based on an exponential moving average and incorporate standard deviation multipliers to represent potential price ranges.
Why it may be useful
The Probability Envelopes Indicator provides traders with a sophisticated statistical approach to understanding potential price movements beyond traditional technical analysis methods. By converting historical price data into probabilistic predictions, it offers insights into potential market behavior that can enhance decision-making processes.
This indicator's unique approach allows traders to quantify market uncertainty and potential price ranges with mathematical precision. Its versatility across different financial instruments and customizable parameters make it a powerful tool for traders seeking a more nuanced understanding of market dynamics.
When to explore it
The Probability Envelopes Indicator is most effective in markets with clear historical price patterns and consistent volatility characteristics. It works best when traders want to identify potential support and resistance levels based on statistical probability rather than purely visual or subjective analysis.
Traders should utilize this indicator in conjunction with other technical analysis tools to confirm signals and reduce the risk of false predictions. It is particularly useful during periods of moderate market volatility where historical data can provide meaningful insights into potential future price movements.
Keep exploring
What we’ve verified
Access, alerts and repainting behaviour have not been independently verified for this indicator. Check the creator’s current publication and settings.
General descriptions and classifications are recovered research. Verified details above identify the specific checks we have completed. Check the creator’s current publication for later changes.