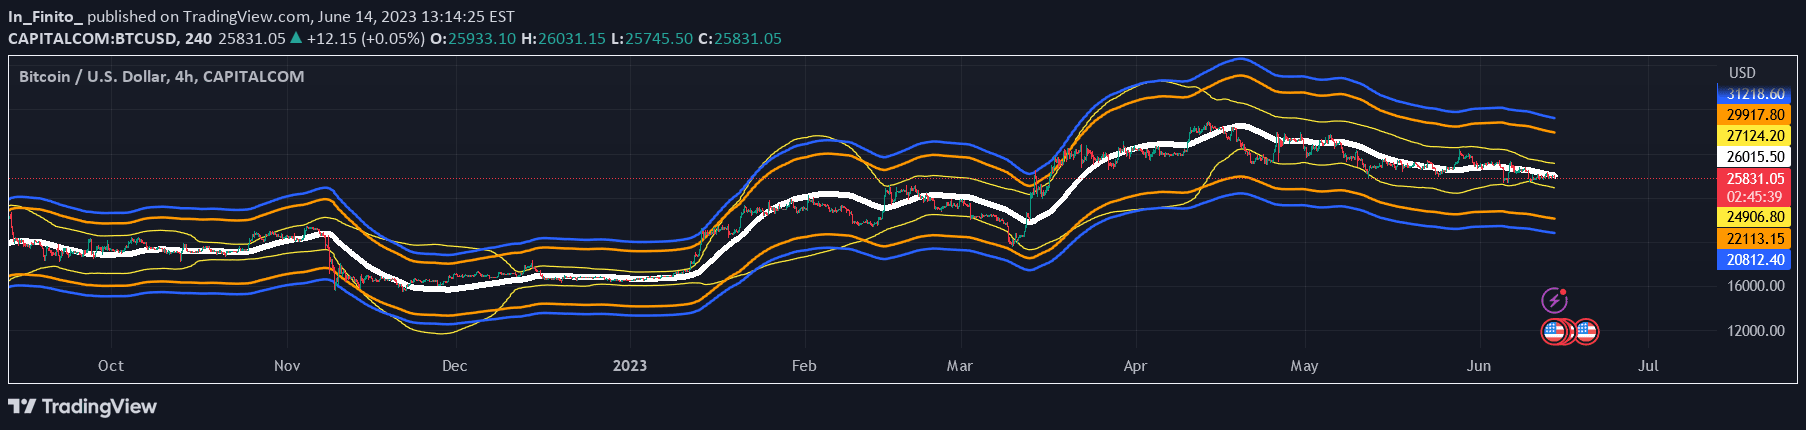
A Pro Bollinger Bands Calculator that analyzes historical price data to detect consecutive candlestick patterns and predict potential market movements using Bollinger Bands.
Explore complementary indicator rolesHow it works
The Pro Bollinger Bands Calculator operates by first computing Bollinger Bands using a specified length and deviation parameter. It tracks consecutive candlesticks that close consistently above or below these bands, creating a systematic approach to identifying potential trend movements.
The indicator meticulously labels and tracks these consecutive candles, color-coding them to represent bullish (green) or bearish (red) patterns. By analyzing the relationship between price action and Bollinger Bands, it generates probabilistic predictions about upcoming candlestick directions and provides comprehensive statistical insights.
Why it may be useful
Bollinger Bands are crucial for traders seeking to understand market volatility and potential trend reversals. By providing a dynamic view of price movements relative to statistical bands, this indicator helps traders identify potential overbought or oversold conditions with greater precision.
The tool's strength lies in its ability to transform complex price data into actionable insights, offering traders a systematic method for interpreting market dynamics. Its customizable parameters and detailed statistical presentation enable traders to adapt the indicator to various market conditions and trading strategies.
When to explore it
The Pro Bollinger Bands Calculator is most effective in markets experiencing moderate to high volatility, where price movements demonstrate clear trending characteristics. It performs exceptionally well in liquid markets with consistent price action, such as major forex pairs, stock indices, and prominent cryptocurrencies.
Traders should leverage this indicator during periods of established market trends, using its consecutive candle analysis to confirm potential entry and exit points. It is particularly valuable when combined with other technical indicators to validate signals and enhance overall trading decision-making processes.
Keep exploring
What we’ve verified
Access, alerts and repainting behaviour have not been independently verified for this indicator. Check the creator’s current publication and settings.
General descriptions and classifications are recovered research. Verified details above identify the specific checks we have completed. Check the creator’s current publication for later changes.