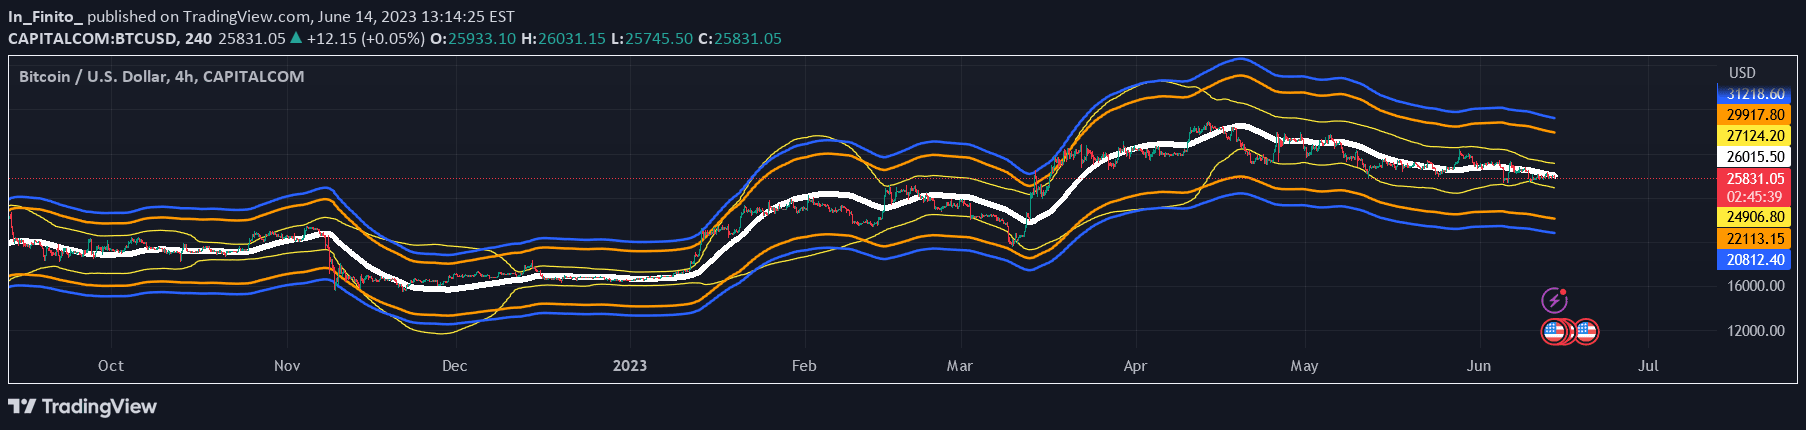
An advanced Bollinger Bands variation using exponential moving averages to measure price volatility and identify potential price movement ranges more dynamically.
Explore complementary indicator rolesHow it works
The indicator calculates price volatility using exponential moving averages instead of traditional simple moving averages, providing a more responsive analysis of market dynamics. By applying an exponential moving average to the price data, the indicator creates a central line representing the average price, then adds upper and lower bands based on standard deviation calculations.
These bands dynamically expand and contract based on recent price movements, with the width reflecting current market volatility. The multiplier parameter allows traders to adjust the sensitivity of the bands, controlling how far they extend from the central moving average line.
Why it may be useful
This advanced Bollinger Bands variant offers traders a more nuanced view of market volatility by emphasizing recent price data through exponential moving averages. The dynamic nature of the bands helps traders identify potential trend changes, breakout opportunities, and periods of increased or decreased market volatility.
By providing a flexible framework for analyzing price movements, the indicator helps traders make more informed decisions about market conditions. The ability to switch between simple and exponential moving averages gives traders additional flexibility in interpreting market trends and potential price reversals.
When to explore it
The indicator works best in markets with clear trending or ranging characteristics, where price volatility plays a significant role in trading decisions. Traders can utilize this tool most effectively during periods of moderate to high market activity, where price movements are more pronounced and meaningful.
It is particularly useful in identifying potential breakout points, measuring market volatility, and providing visual cues about potential trend reversals. Traders should combine this indicator with other technical analysis tools to confirm signals and reduce the likelihood of false positives.
Keep exploring
What we’ve verified
Access, alerts and repainting behaviour have not been independently verified for this indicator. Check the creator’s current publication and settings.
General descriptions and classifications are recovered research. Verified details above identify the specific checks we have completed. Check the creator’s current publication for later changes.