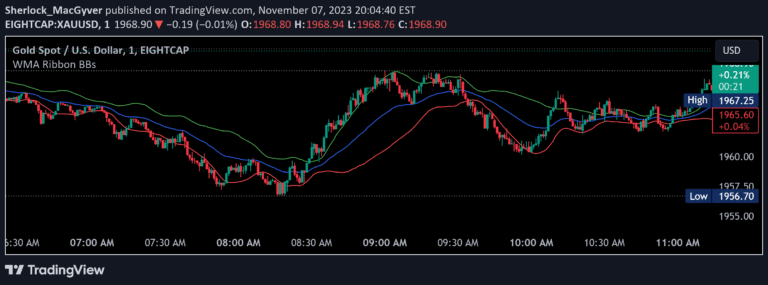
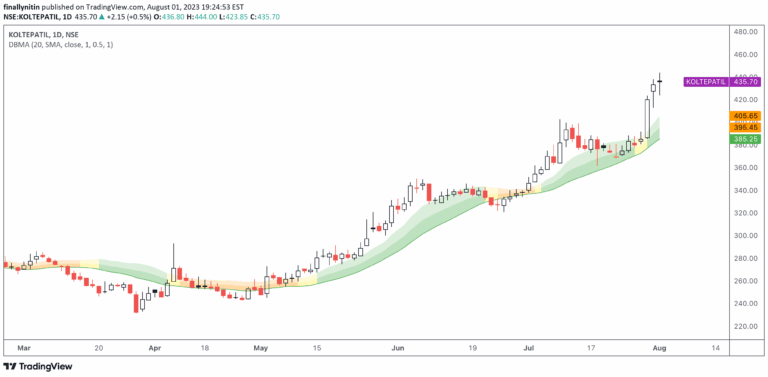
An Exponential Moving Average with Average Daily Range bands that dynamically tracks price movements and volatility, providing adaptive support and resistance levels.
Explore complementary indicator rolesHow it works
The indicator first calculates an Exponential Moving Average (EMA) of closing prices using a specified length, which smooths price data and reveals the underlying trend direction. It then computes the Average Daily Range (ADR) by calculating the average difference between daily high and low prices over the same period.
The ADR is multiplied by a user-defined multiple to create upper and lower bands around the EMA, effectively generating a dynamic volatility channel. These bands expand and contract based on market conditions, providing traders with a visual representation of potential support and resistance zones that adapt to changing price dynamics.
Why it may be useful
The EMA with ADR bands offers traders a sophisticated method of understanding market momentum and volatility simultaneously, combining trend analysis with real-time market movement insights. By integrating both directional trend and price range information, traders can make more informed decisions about potential entry and exit points.
This indicator is particularly valuable because it provides a flexible, adaptive framework for analyzing market conditions, allowing traders to quickly assess whether current price action represents a significant movement or a typical market fluctuation. The dynamic nature of the bands helps traders identify potential breakout and reversal points with greater precision.
When to explore it
The EMA with ADR bands is most effective in markets with moderate to high volatility, where price movements are significant enough to generate meaningful range data. It works particularly well in trending markets where the EMA can clearly indicate directional momentum and the ADR bands can highlight potential trend continuation or reversal points.
Traders should consider using this indicator across multiple timeframes, from short-term scalping to longer-term swing trading strategies. It is especially useful when combined with other technical indicators that can confirm trend strength, volume, or momentum, providing a more comprehensive view of market conditions.
Keep exploring
What we’ve verified
Access, alerts and repainting behaviour have not been independently verified for this indicator. Check the creator’s current publication and settings.
General descriptions and classifications are recovered research. Verified details above identify the specific checks we have completed. Check the creator’s current publication for later changes.