Intersection Value Functions
Advanced trading signal that calculates precise intersection points between two data series, offering detailed insights into potential trend changes and crossover events.
Explore 11,183 indicators. Filter beyond the obvious.
Discover the tools that fit the way you trade.
11,183 tools to explore
Advanced trading signal that calculates precise intersection points between two data series, offering detailed insights into potential trend changes and crossover events.
Rolling VWAP Channel creates a dynamic indicator using multiple Volume Weighted Average Prices to analyze price clusters and potential market directional changes through percentile interpolation.
Theta Shield is an options trading indicator that uses stochastic oscillation to predict market sideways phases and help traders avoid potential theta decay in option positions.
An advanced market analysis tool that breaks down price data into intrinsic mode functions, revealing hidden market cycles and trends through adaptive signal processing.
HILO Interpolation is a dynamic trading signal that uses percentile-based price bands to identify trend shifts and breakouts across different market conditions with adaptive thresholds.
A normal distribution curve overlay that visually maps the probability of price movements, helping traders identify outliers, potential support/resistance zones, and market inefficiencies across different assets and timeframes.
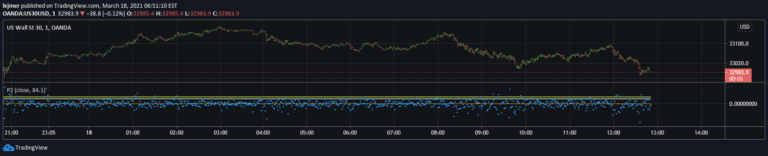
A statistical method for estimating percentiles in financial data series using the P-Square algorithm, which provides a fast and accurate approach to understanding data distribution and variability.
A Value at Risk (VaR) indicator that quantifies potential portfolio losses and classifies market risk into Risk On, Risk Off, and Risk Neutral phases using multiple statistical models.
A pivot point-based indicator that interpolates three pivot highs or lows to forecast potential bullish and bearish breakouts with color-coded visual extrapolations.
An advanced Bollinger Bands variation using exponential moving averages to measure price volatility and identify potential price movement ranges more dynamically.
An advanced wavelet filtering system that decomposes price data into frequency components, removes noise, and reconstructs signals to enhance trend detection and market analysis.
A market phase indicator using Detrended Price Oscillator (DPO) to analyze and compare trends across different asset classes, bonds, and stock sectors.
Likes, views, and comments are historical TradingView snapshots. They describe attention, not trading performance.