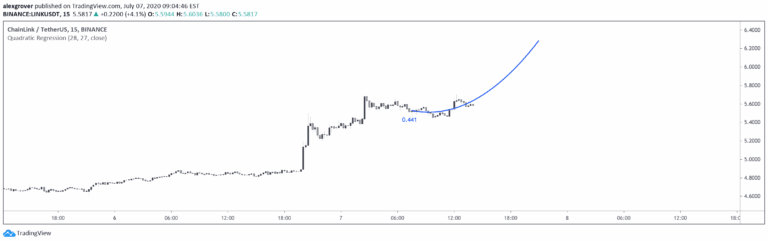
HILO Interpolation is a dynamic trading signal that uses percentile-based price bands to identify trend shifts and breakouts across different market conditions with adaptive thresholds.
Explore complementary indicator rolesHow it works
HILO Interpolation calculates upper and lower percentile thresholds from historical price data using linear interpolation. It defines a 75th percentile upper threshold and a 50th percentile lower threshold to track price movements.
The signal dynamically switches based on price position relative to these bands. When price exceeds the upper threshold, it generates a short signal, and when price falls below the lower threshold, it triggers a long signal. Between these thresholds, the system maintains trend continuation logic
Why it may be useful
HILO Interpolation provides traders with an adaptive, noise-reduced method for identifying market trends and potential entry points. By using percentile-based calculations, it overcomes limitations of traditional static crossover systems.
The indicator offers more nuanced trend detection by intelligently responding to price movements across different market conditions. Its interpolation technique minimizes false signals and provides early trend identification, giving traders a more responsive tool for making trading decisions
When to explore it
HILO Interpolation works best in markets with clear trending or range-bound conditions. It is particularly effective for breakout traders seeking early trend starts and swing traders identifying directional bias shifts.
The indicator performs well across various asset classes and timeframes, offering flexibility for different trading strategies. Traders can utilize it to catch trend initiations, play range reversions, and incorporate percentile logic into broader trading systems
Keep exploring
What we’ve verified
Access, alerts and repainting behaviour have not been independently verified for this indicator. Check the creator’s current publication and settings.
General descriptions and classifications are recovered research. Verified details above identify the specific checks we have completed. Check the creator’s current publication for later changes.