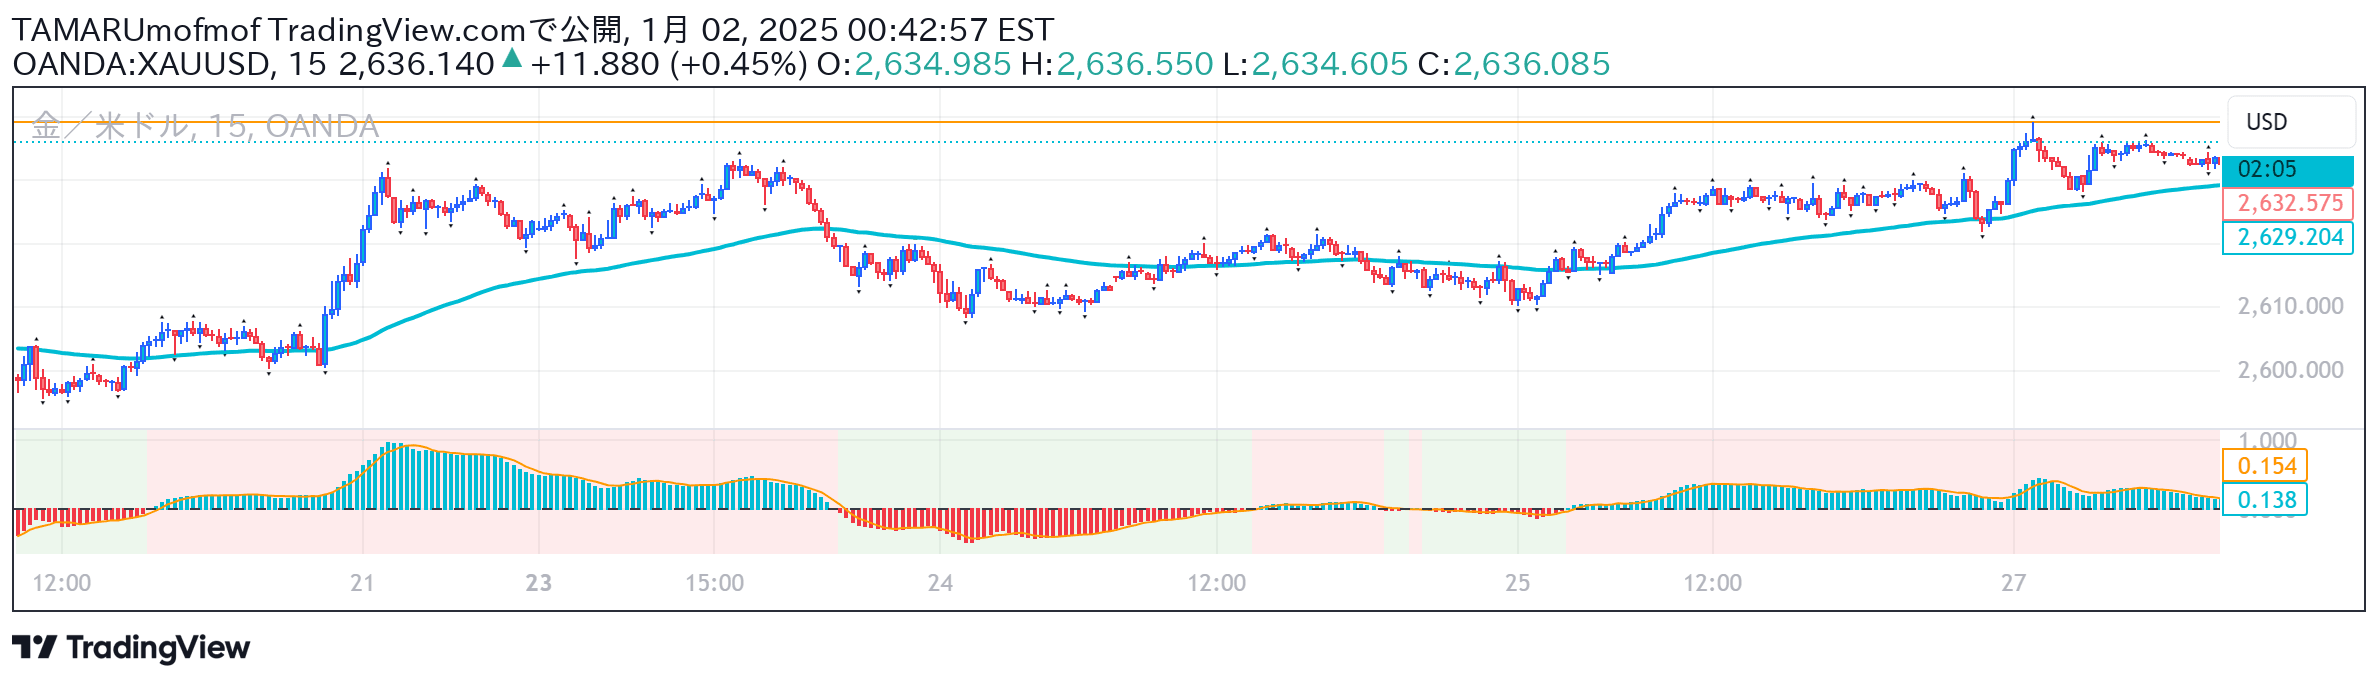
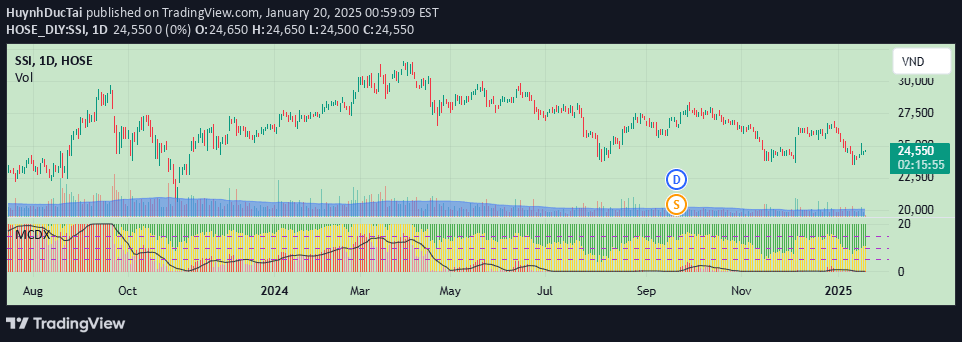
An advanced market analysis tool that breaks down price data into intrinsic mode functions, revealing hidden market cycles and trends through adaptive signal processing.
Explore complementary indicator rolesHow it works
The Empirical Mode Decomposition (EMD) Oscillator works by decomposing complex price data into simpler Intrinsic Mode Functions (IMFs), each representing different market frequency cycles. It uses a sophisticated sifting process that detects local extrema, creates smooth envelopes through cubic spline interpolation, and extracts unique oscillations from the price data.
By isolating these IMFs, the indicator can reconstruct a signal that captures both short-term market fluctuations and long-term trends. The process involves repeatedly refining the data, removing mean trends, and selecting specific IMFs to create a normalized oscillator that ranges between -1 and 1, making it easy for traders to interpret market conditions.
Why it may be useful
The EMD Oscillator provides traders with a sophisticated, adaptive tool that goes beyond traditional technical indicators by dynamically analyzing market cycles. Unlike fixed-parameter methods, this indicator intuitively adjusts to changing market conditions, revealing hidden patterns and cycles that standard oscillators might miss.
By breaking down price data into multiple frequency components, traders gain deeper insights into market behavior, allowing for more nuanced interpretation of trend strength, potential reversals, and underlying market dynamics. This approach makes the EMD Oscillator particularly valuable in complex, non-linear market environments where traditional indicators may fall short.
When to explore it
The EMD Oscillator is most effective in markets with complex, non-linear price movements where traditional indicators struggle to provide clear signals. It works exceptionally well in volatile markets, cryptocurrency trading, and financial instruments with intricate price patterns that require more advanced analytical techniques.
Traders should utilize this indicator when seeking to identify subtle market cycles, confirm trend strength, and detect potential trend reversals. It is particularly useful for confirming divergences, spotting overbought and oversold conditions, and gaining a more comprehensive understanding of market dynamics across different timeframes.
Keep exploring
What we’ve verified
Access, alerts and repainting behaviour have not been independently verified for this indicator. Check the creator’s current publication and settings.
General descriptions and classifications are recovered research. Verified details above identify the specific checks we have completed. Check the creator’s current publication for later changes.