
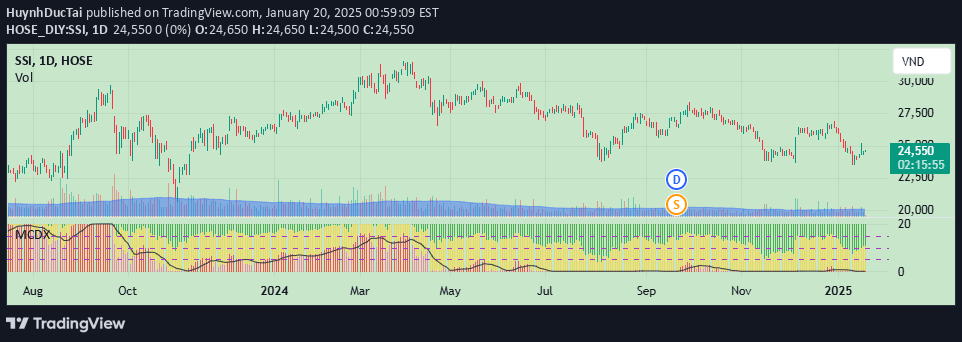
The MCDX indicator analyzes market cycles by tracking big money flow and small money movements through a distinctive histogram with red and green bars representing different money flow dynamics.
Explore complementary indicator rolesHow it works
The MCDX indicator works by tracking and visualizing money flow dynamics within financial markets through a specialized histogram. It differentiates between big money inflows (represented by red bars) and small money movements (represented by green bars).
By analyzing these color-coded bars, traders can gain insights into the underlying market sentiment and potential directional shifts. The indicator essentially maps out the relative strength and movement of different market participant groups, providing a unique perspective on market cycles and potential trend changes.
Why it may be useful
The MCDX indicator matters because it offers traders a nuanced view of market dynamics beyond traditional price action analysis. By revealing the flow of big and small money, it provides insights into potential market movements and underlying sentiment.
This approach allows traders to understand not just price changes, but the motivations and behaviors of different market participants. By tracking these money flow patterns, traders can make more informed decisions about potential trend reversals, market strength, and potential future price movements.
When to explore it
The MCDX indicator is most effective during periods of significant market transitions or when seeking to understand underlying market sentiment. It works particularly well in markets with clear institutional participation and observable money flow patterns.
Traders should consider using MCDX when they want to supplement traditional technical analysis with insights into money flow dynamics. It is especially useful in volatile markets where understanding the behavior of different market participant groups can provide a strategic advantage in trading decisions.
Keep exploring
What we’ve verified
Access, alerts and repainting behaviour have not been independently verified for this indicator. Check the creator’s current publication and settings.
General descriptions and classifications are recovered research. Verified details above identify the specific checks we have completed. Check the creator’s current publication for later changes.


