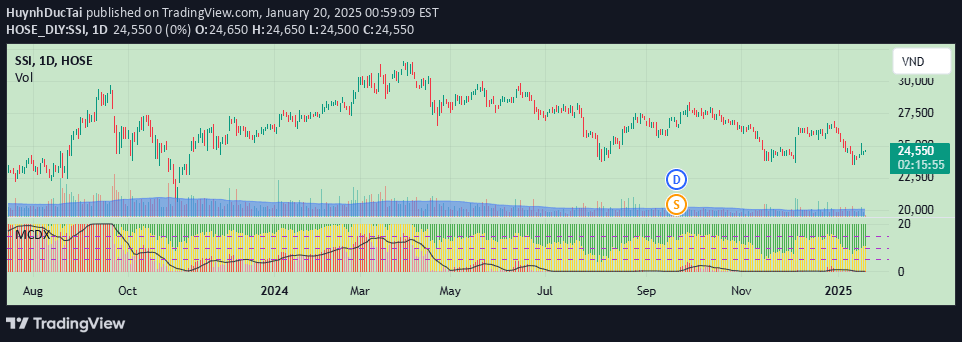
A dynamic volume analysis tool that examines current candle volume relative to past performance, providing insights into market trends and potential trading opportunities.
Explore complementary indicator rolesHow it works
The PROWIN STUDY BASIC CURRENT CANDLE TABLE analyzes volume dynamics by comparing the current candle's volume against the last 50 candles. It calculates average volumes for bullish and bearish candles, identifying trend direction by comparing current and previous close prices.
The indicator computes volume slopes and angles of inclination for green, red, and average volume lines. This mathematical approach allows traders to understand volume trends and potential market momentum through a comprehensive, data-driven visualization.
Why it may be useful
Volume analysis is crucial for understanding market sentiment and potential price movements. By providing detailed insights into trading volume trends, this indicator helps traders make more informed decisions about market direction and potential entry or exit points.
The dynamic table and real-time updates enable traders to quickly assess market conditions, identifying whether current volume patterns suggest bullish or bearish trends. This information can be particularly valuable for traders seeking to confirm price movements with volume-based evidence.
When to explore it
This indicator is most effective in highly liquid markets with consistent trading volume, such as major stock indices, forex pairs, and actively traded commodities. Traders can use it to validate potential trend reversals or confirm existing market momentum.
The tool is particularly useful during periods of market volatility, where volume changes can signal significant shifts in trader sentiment. Scalpers and day traders will find this indicator especially beneficial for making quick, data-driven trading decisions based on volume dynamics.
Keep exploring
What we’ve verified
Access, alerts and repainting behaviour have not been independently verified for this indicator. Check the creator’s current publication and settings.
General descriptions and classifications are recovered research. Verified details above identify the specific checks we have completed. Check the creator’s current publication for later changes.