
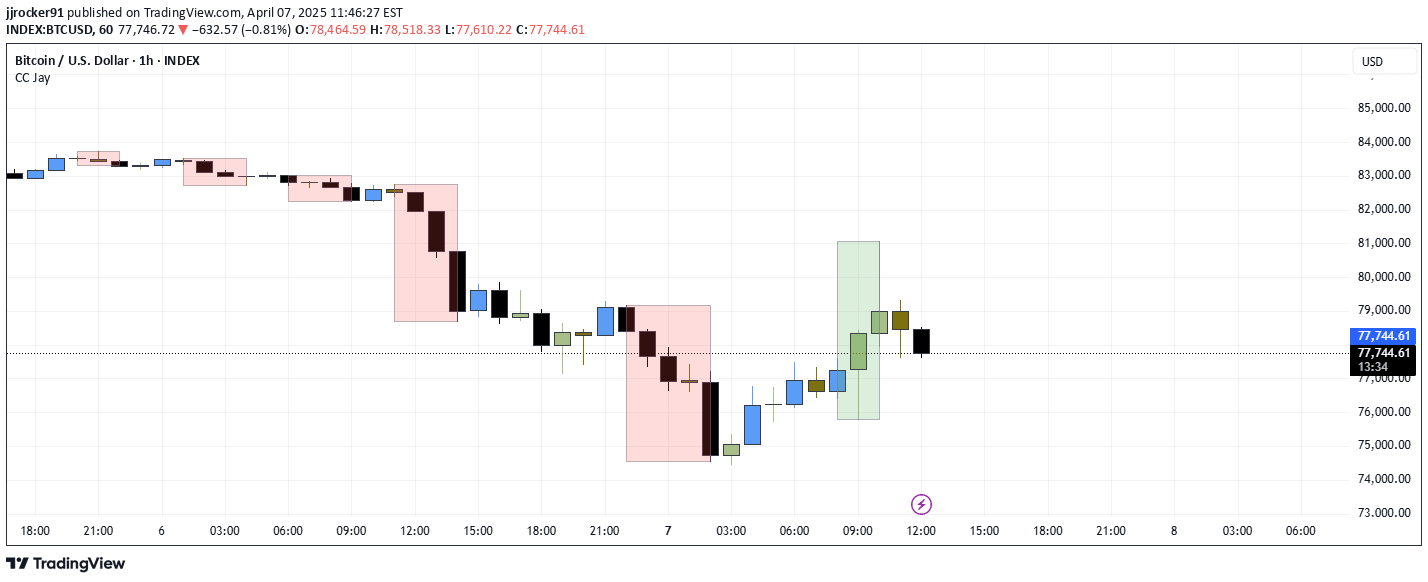
A technical indicator that visually highlights consecutive bullish or bearish candle sequences by drawing boxes, helping traders quickly identify short-term price momentum and potential trend shifts.
Explore complementary indicator rolesHow it works
The indicator tracks consecutive candles with the same color (bullish or bearish) bar by bar across the chart. When a sequence reaches a predefined minimum length (default 3 candles), it draws a box around the sequence.
The box's top is set at the highest high price, and the bottom at the lowest low price. The left edge aligns with the first candle's start time, and the right edge with the last candle's end time. The box is drawn when the sequence is broken by an opposite-colored candle or a doji
Why it may be useful
This momentum visualization tool helps traders quickly identify periods of sustained buying or selling pressure. By providing a clear, visual representation of consecutive candle sequences, it offers insights into market sentiment and potential trend strength.
Traders can use these boxes to spot momentum shifts, potential exhaustion points, and consolidation breakouts. The indicator transforms raw price action data into an easily interpretable graphical format, making it easier to recognize emerging market trends
When to explore it
The indicator works best in markets with clear, trending behavior and during periods of sustained price movement. It is particularly useful for day traders and swing traders looking to identify short-term momentum.
Traders should apply this tool in conjunction with other technical analysis methods, using it to confirm entry and exit signals. It's most effective in liquid markets with consistent price action, such as major forex pairs, stock indices, and actively traded commodities
Keep exploring
What we’ve verified
Access, alerts and repainting behaviour have not been independently verified for this indicator. Check the creator’s current publication and settings.
General descriptions and classifications are recovered research. Verified details above identify the specific checks we have completed. Check the creator’s current publication for later changes.


