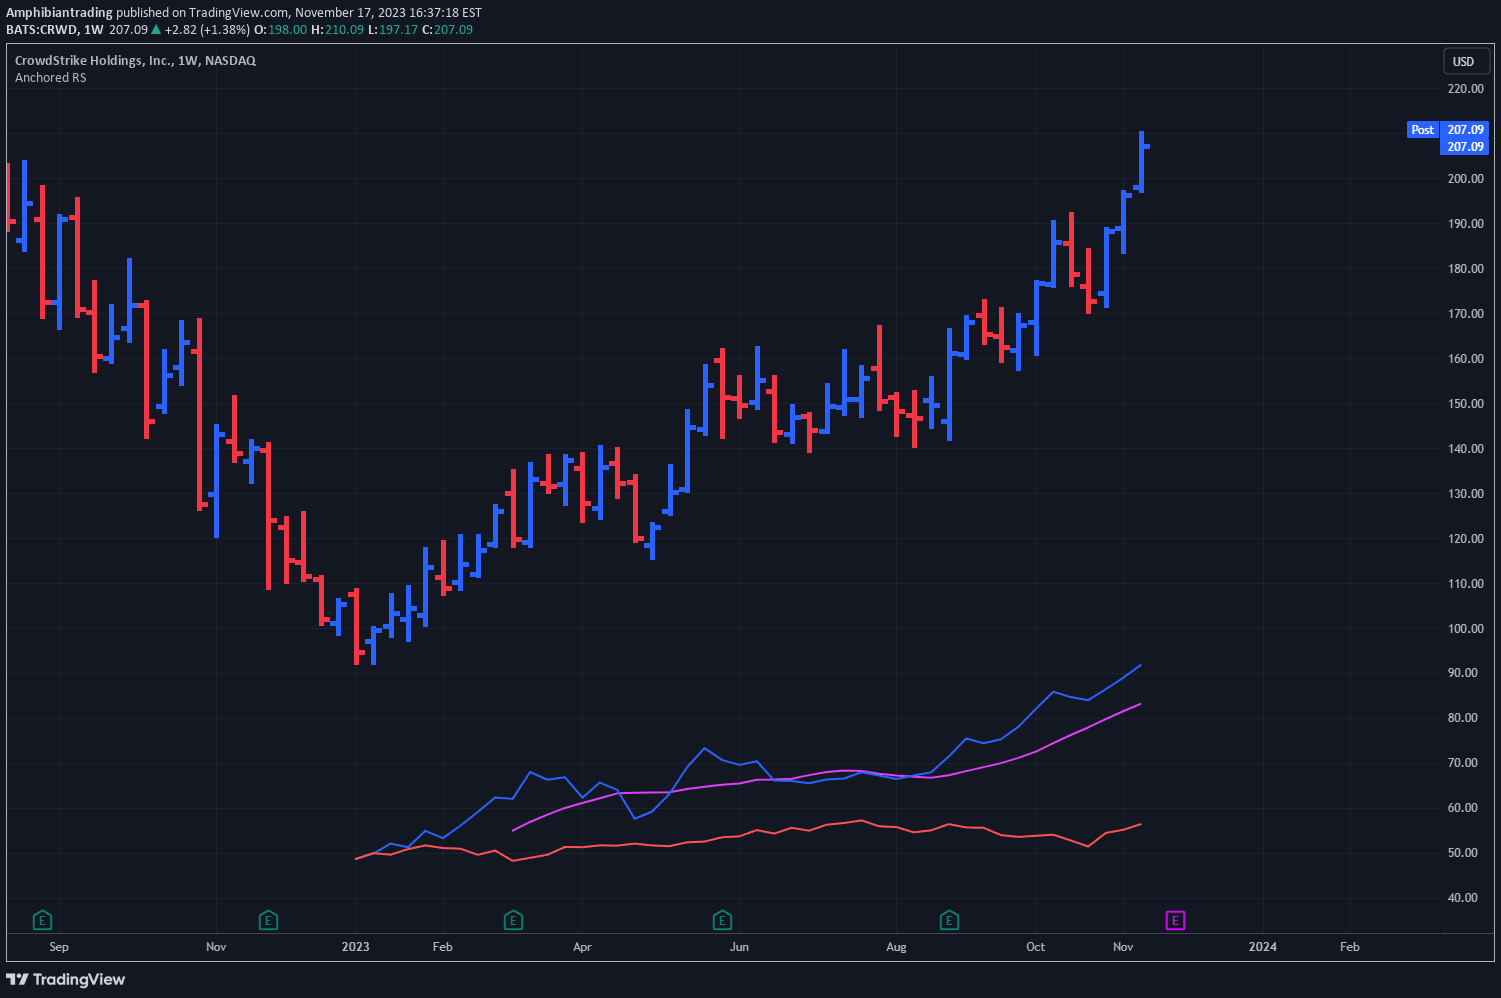
A relative strength indicator comparing a stock's performance to an index by measuring the distance from moving averages, providing insights into comparative market behavior.
Explore complementary indicator rolesHow it works
MARS calculates relative strength by comparing a stock's distance from its moving average to an index's similar distance. It uses customizable moving average types and lengths to determine the comparative performance between a stock and its benchmark index.
The indicator generates visual signals through background colors and histogram bars, representing different performance scenarios. Blue backgrounds indicate the index is above its moving average, while pink backgrounds show the index is below its moving average, creating a quick visual reference for market conditions.
Why it may be useful
Traders need comprehensive market context to make informed decisions, and MARS provides a nuanced view of a stock's performance relative to its broader market index. By showing comparative strengths and weaknesses, it helps traders understand whether a stock is outperforming or underperforming its benchmark, which can signal potential investment opportunities.
The indicator's multiple performance categories, such as relative, gross, and absolute out-performance or under-performance, offer traders granular insights into market dynamics. These detailed visualizations help investors quickly assess market sentiment and make more strategic trading decisions.
When to explore it
MARS is most effective in markets with clear trending behavior, where stocks and indices show consistent directional movements. It works best when traders want to compare a stock's performance against a broader market index, helping to identify potential divergences and relative strengths.
The indicator is particularly useful during periods of market volatility, when understanding comparative performance can provide critical insights. Traders can customize the moving average type and length to suit different market conditions and trading styles, making it a versatile tool for various investment strategies.
Keep exploring
What we’ve verified
Access, alerts and repainting behaviour have not been independently verified for this indicator. Check the creator’s current publication and settings.
General descriptions and classifications are recovered research. Verified details above identify the specific checks we have completed. Check the creator’s current publication for later changes.