Interactive ATR Stop-Loss [TANHEF]
An interactive ATR-based trailing stop-loss indicator that helps traders manage risk dynamically by adjusting stop-loss levels based on market volatility and price movement.
Explore 11,183 indicators. Filter beyond the obvious.
Discover the tools that fit the way you trade.
11,183 tools to explore
An interactive ATR-based trailing stop-loss indicator that helps traders manage risk dynamically by adjusting stop-loss levels based on market volatility and price movement.
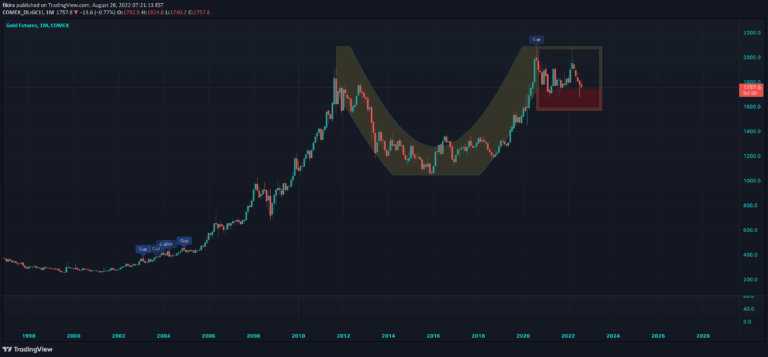
Cup & Handle is a technical chart pattern that identifies potential bullish trend continuation by analyzing price movements and pivot points, revealing possible upward breakout opportunities.
A dynamic heatmap tool that identifies potential liquidity zones by analyzing historical price movements and volume concentration, revealing hidden market dynamics.
A trend strength indicator using Modified Hull Moving Average with a visual gauge that shows trend direction and intensity through color and transparency gradients.
An advanced technical analysis tool that uses standard deviation and exponential moving averages to identify market conditions and potential trend reversals with improved accuracy.
A comprehensive trading system using machine-engineered signals combining RSI, SuperTrend, and adaptive candle coloring for precise market entry and trend detection.
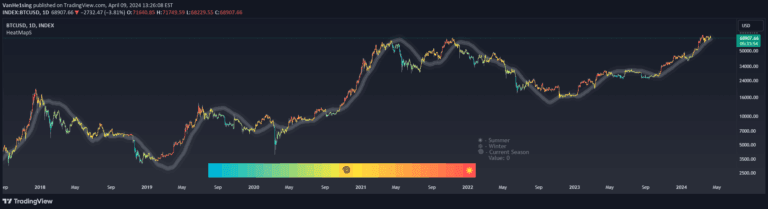
Heat Map Seasons indicator visualizes market dynamics through seasonal trends, using regression analysis and color-coded heat map to highlight market volatility and potential sentiment shifts.
A machine learning trading indicator using logistic regression that combines multiple technical indicators to generate potential buy and sell signals with systematic decision-making.
A machine learning-based technical analysis tool combining RSI and MFI to identify potential trade opportunities by calculating distances between current and historical market data points.
A powerful trend identification indicator combining Commodity Channel Index and Average True Range to detect market trends with dynamic support and resistance levels.
A comprehensive market breadth indicator combining McClellan Summation Index with Heikin-Ashi visualization and MACD analysis to provide advanced trend and momentum insights.
MVRV Z-Score analyzes Bitcoin's market value and realized value to identify potential market tops and bottoms by measuring valuation extremes.
Likes, views, and comments are historical TradingView snapshots. They describe attention, not trading performance.