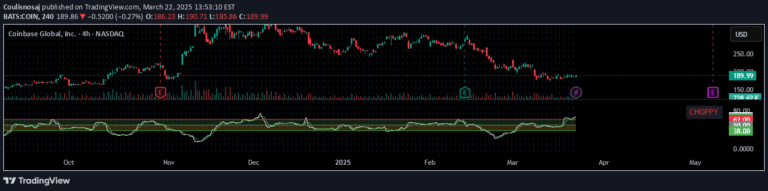
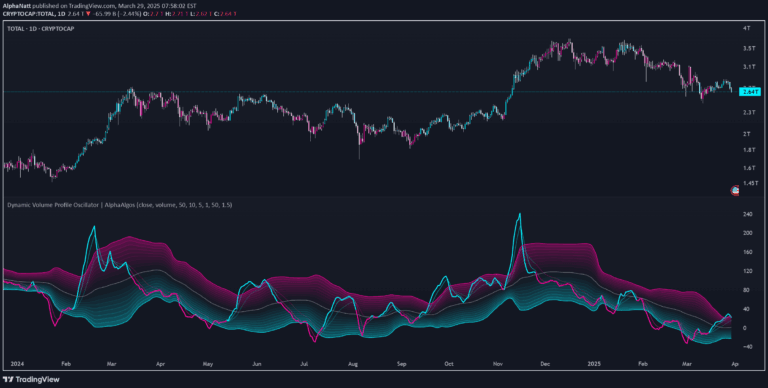
A momentum indicator that measures the rate of change of price acceleration, detecting potential trend reversals through normalized second-derivative analysis with color-coded visual signals.
Explore complementary indicator rolesHow it works
The Normalized ROC² Histogram calculates the second derivative of price movement, tracking momentum acceleration and deceleration through a normalized scale from 0 to 100. By measuring the rate of change of the rate of change, it identifies subtle shifts in price momentum that might precede trend reversals.
The indicator dynamically changes color to provide visual cues about momentum strength, with dark and light shades representing increasing and decreasing momentum in both positive and negative directions. Zero line crossovers are particularly significant, signaling potential trend direction changes when the histogram transitions between positive and negative values.
Why it may be useful
This indicator provides traders with an advanced momentum analysis tool that goes beyond traditional first-derivative momentum measurements by examining price acceleration. Its ability to detect early signs of momentum shifts can help traders anticipate potential trend reversals before they become obvious through traditional price action.
The normalized scaling and color-coded visualization make complex momentum data more accessible and interpretable, allowing traders to quickly understand market dynamics without getting lost in complex mathematical calculations.
When to explore it
The Normalized ROC² Histogram works best in markets with clear trending characteristics, where momentum changes can signal significant price reversals. It is particularly effective when combined with other technical analysis tools like volume profile, moving averages, and market structure analysis to confirm potential trade setups.
Traders should pay special attention to zero line crossovers and color transitions, using these signals as potential entry or exit points. The indicator is most reliable when used across multiple timeframes and validated by complementary technical and fundamental analysis techniques.
Keep exploring
What we’ve verified
Access, alerts and repainting behaviour have not been independently verified for this indicator. Check the creator’s current publication and settings.
General descriptions and classifications are recovered research. Verified details above identify the specific checks we have completed. Check the creator’s current publication for later changes.