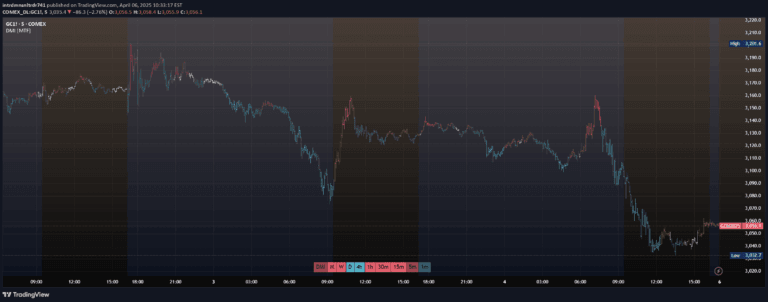
The Risk-Adjusted Return Oscillator analyzes asset performance by measuring risk-return relationships, helping traders identify potential price reversals and trend accelerations.
Explore complementary indicator rolesHow it works
The Risk-Adjusted Return Oscillator calculates performance by evaluating the relationship between returns and standard deviation over a specified period. It generates a curve that fluctuates within a defined range, tracking the asset's risk-adjusted performance through smoothed calculations.
The oscillator creates upper and lower boundary lines representing overbought and oversold levels. When the curve reaches these lines, it signals potential price action, with interpretations varying depending on whether the market is ranging or trending.
Why it may be useful
The Risk-Adjusted Return Oscillator provides traders with a comprehensive view of an asset's performance by integrating risk and return metrics into a single indicator. By considering both price movement and volatility, it offers more nuanced insights than traditional price-only analysis, helping traders make more informed decisions.
This oscillator is particularly valuable because it adapts its signals based on market context, offering different interpretations in ranging and trending markets. It helps traders identify potential entry and exit points while accounting for the underlying market dynamics.
When to explore it
The Risk-Adjusted Return Oscillator works best in markets with clear directional movements and sufficient volatility to generate meaningful signals. It is most effective when used in conjunction with other technical indicators to confirm potential trade setups and validate market conditions.
Traders should pay special attention to the oscillator's signals during key market transitions, such as potential trend reversals or momentum shifts. Its effectiveness increases when applied to liquid markets with consistent price action and when traders carefully adjust its period length and smoothing parameters.
Keep exploring
What we’ve verified
Access, alerts and repainting behaviour have not been independently verified for this indicator. Check the creator’s current publication and settings.
General descriptions and classifications are recovered research. Verified details above identify the specific checks we have completed. Check the creator’s current publication for later changes.