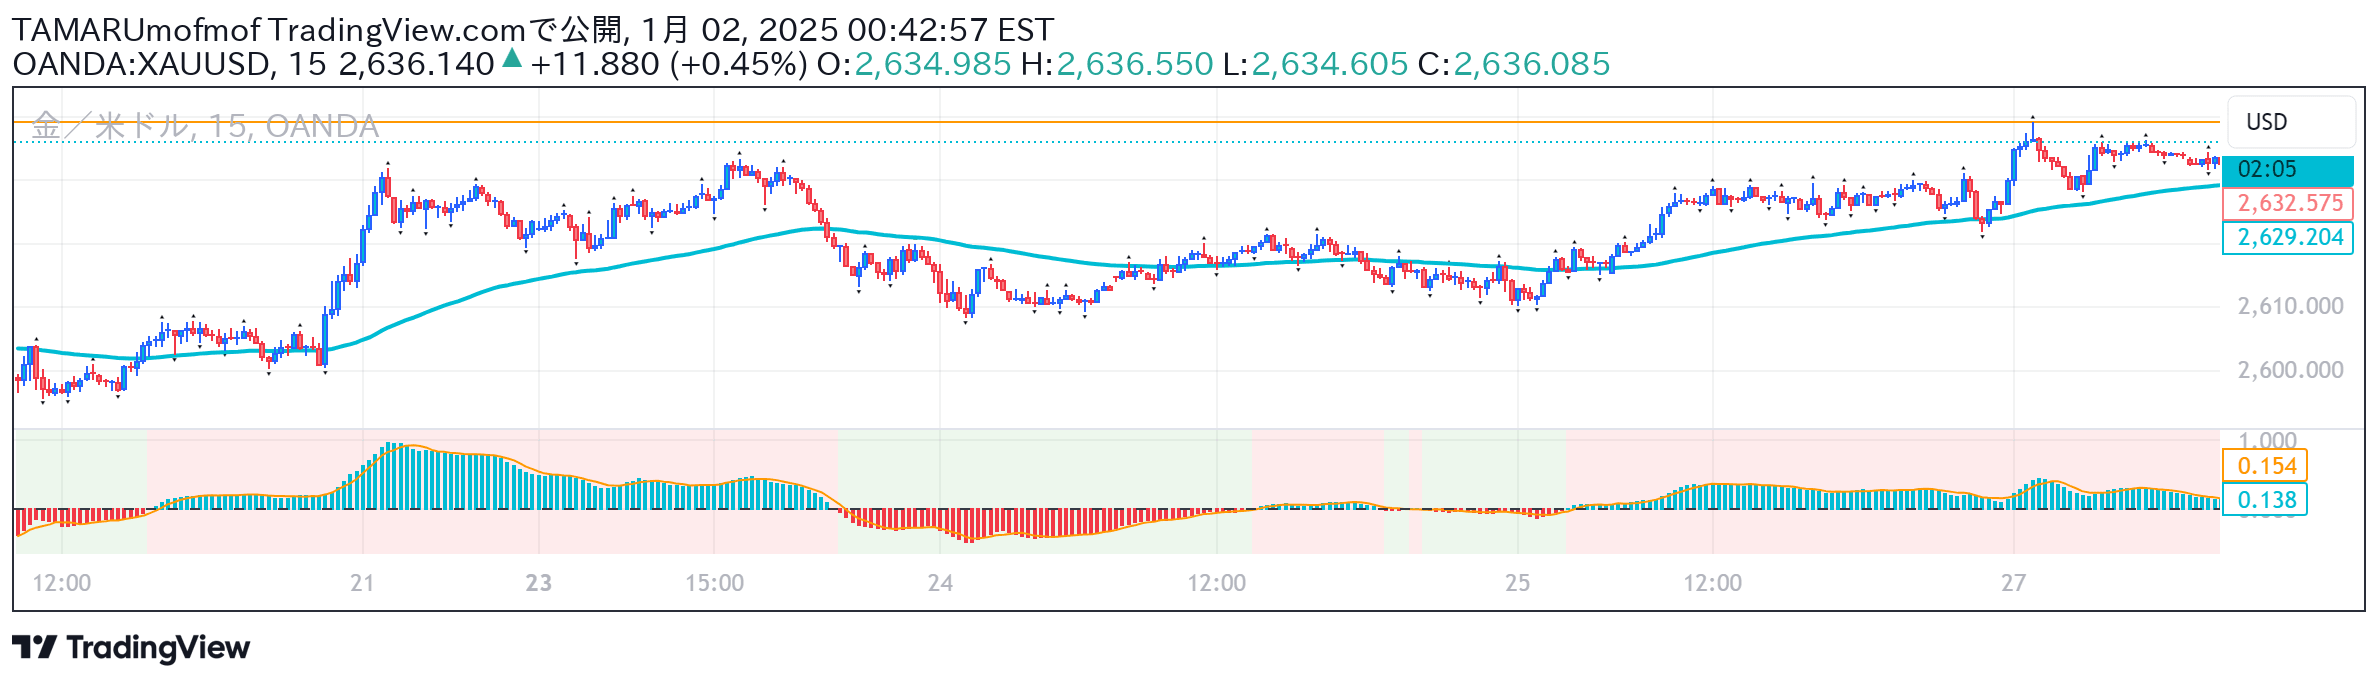
The 25-Line Oscillator is a technical analysis tool using multiple Simple Moving Averages to visualize market trends and momentum across different time frames.
Explore complementary indicator rolesHow it works
The 25-Line Oscillator calculates 26 Simple Moving Averages with progressively increasing base lengths. Each SMA is plotted with a unique color in a rainbow scheme, creating a visual representation of price dynamics. The indicator tracks the interaction between consecutive moving averages, revealing potential trend shifts and momentum changes.
By comparing these moving averages, traders can observe how different time frames interact and influence price movement. The incremental length of SMAs allows for a comprehensive view of market behavior. The rainbow color scheme helps quickly distinguish between different trend lines. Crossover events between these lines can signal potential trading opportunities
Why it may be useful
The 25-Line Oscillator provides traders with a multi-dimensional view of market trends and momentum. By displaying multiple moving averages simultaneously, it offers insights into short-term and long-term price movements. The visual rainbow representation makes trend analysis more intuitive and accessible. Traders can quickly identify potential trend reversals and momentum shifts through line interactions.
The customizable base length allows adaptation to different market conditions and trading styles. This comprehensive approach helps traders make more informed decisions by understanding price dynamics across various time frames. The indicator bridges the gap between complex technical analysis and user-friendly visualization
When to explore it
The 25-Line Oscillator works best in trending markets with clear directional movements. It is particularly effective for swing traders seeking to capture multi-day price trends. The indicator is most reliable when markets exhibit consistent momentum and are not experiencing extreme choppiness. Traders should use it in conjunction with other technical indicators to confirm signals.
It performs well across different asset classes, including stocks, forex, and cryptocurrencies. The tool is most valuable when analyzing markets with sufficient liquidity and regular trading volume. Experienced traders can leverage its insights to identify potential entry and exit points in their trading strategies
Keep exploring
What we’ve verified
Access, alerts and repainting behaviour have not been independently verified for this indicator. Check the creator’s current publication and settings.
General descriptions and classifications are recovered research. Verified details above identify the specific checks we have completed. Check the creator’s current publication for later changes.