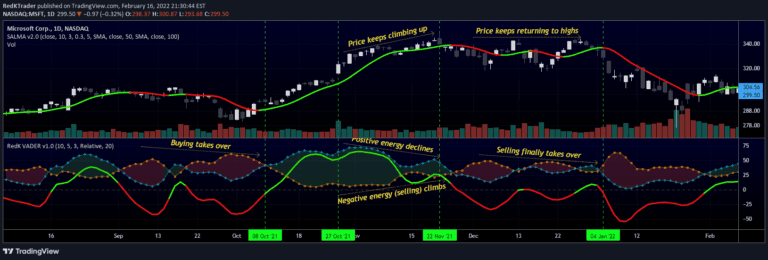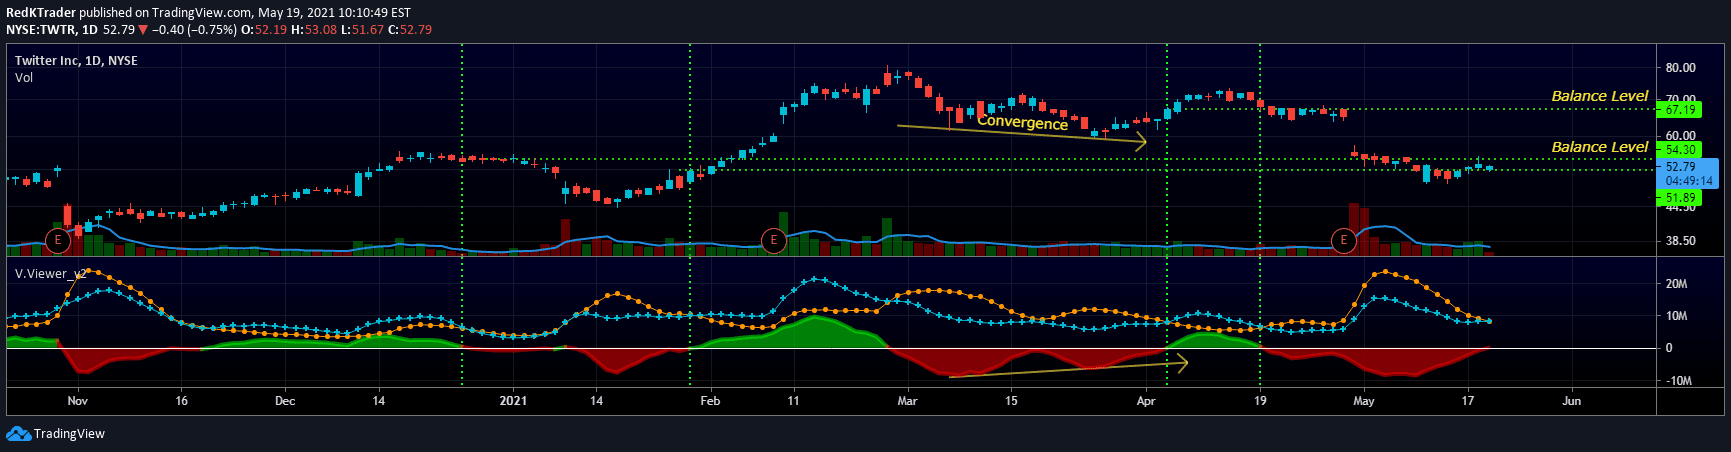
VolumeViewer is an advanced volume indicator that estimates supply and demand dynamics by analyzing price bar shapes, providing insights into market balance and potential key price levels.
Explore complementary indicator rolesHow it works
VolumeViewer calculates volume supply and demand by analyzing price bar characteristics. It assigns a percentage of demand based on the bar's shape, giving extra weight to price bar wicks. The indicator then applies a weighted moving average to smooth the demand and supply lines.
By comparing these lines, traders can visualize the balance between buyers and sellers. The calculation considers green bars as primarily demand and red bars as primarily supply, with neutral bars split evenly
Why it may be useful
This indicator provides traders with a unique perspective on market dynamics by translating volume data into actionable supply and demand insights. It helps identify potential accumulation or distribution phases in trading instruments.
By revealing imbalances in market forces, traders can better understand underlying buying and selling pressures. The visual representation makes it easier to spot key price levels and potential reversal points. It offers a simplified yet effective way to analyze volume without complex Level II or bid/ask data
When to explore it
VolumeViewer works best when analyzing stocks and instruments with reliable volume data. It is particularly useful for identifying potential support and resistance levels based on volume imbalances. Traders should use it in conjunction with other trend and momentum indicators to confirm signals.
It's most effective during periods of significant price movement or when trying to understand market sentiment. The indicator can help traders assess whether buyers or sellers are in control during different market phases
Keep exploring
What we’ve verified
Access, alerts and repainting behaviour have not been independently verified for this indicator. Check the creator’s current publication and settings.
General descriptions and classifications are recovered research. Verified details above identify the specific checks we have completed. Check the creator’s current publication for later changes.