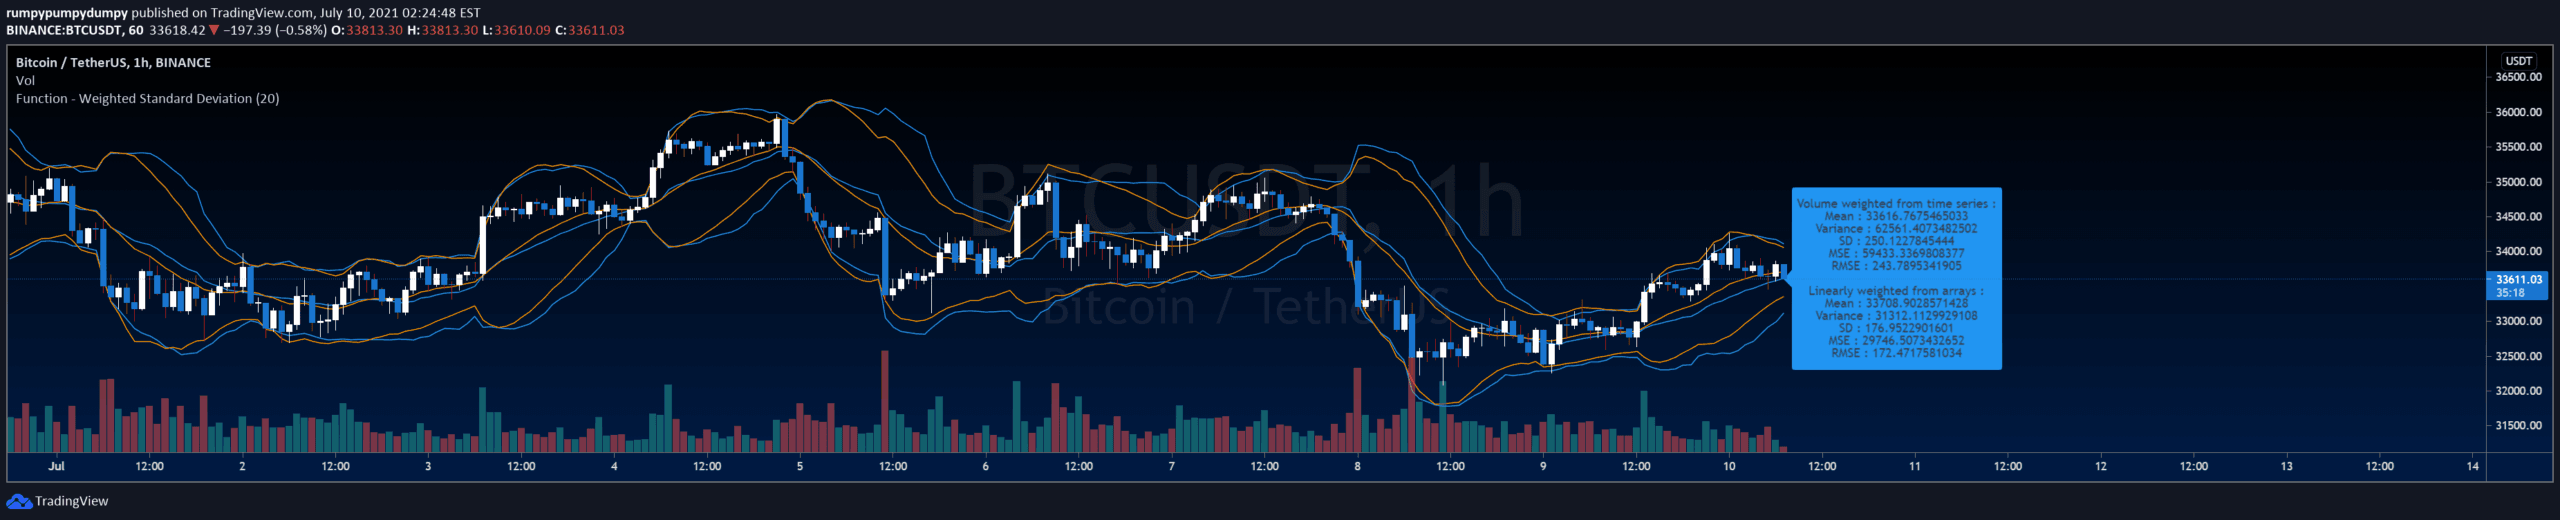
A statistical analysis function that calculates weighted mean, variance, standard deviation, and error metrics for time series data, helping traders understand data distribution and variability.
Explore complementary indicator rolesHow it works
The function takes a time series of variables or arrays, with the most recent sample at index 0. It computes a weighted mean by applying specific weights to each data point, allowing more importance to be given to recent or significant observations.
The function then calculates variance, which measures how far the data points are spread from the mean. Standard deviation is derived from variance, indicating the data's dispersion. Additionally, it computes Mean Squared Error (MSE) and Root Mean Squared Error (RMSE), which quantify the average squared difference between predicted and actual values
Why it may be useful
These statistical metrics are crucial for traders as they provide insights into data variability and predictive accuracy. The weighted mean helps identify central tendencies while giving more weight to recent or significant data points. Variance and standard deviation reveal the spread of data, indicating potential market volatility.
MSE and RMSE help assess the accuracy of trading models or predictions, allowing traders to evaluate and refine their strategies. By understanding these metrics, traders can make more informed decisions, manage risk, and develop more robust trading algorithms
When to explore it
These statistical calculations are most effective when analyzing complex market data with varying significance of historical points. They are particularly useful in algorithmic trading, backtesting strategies, and developing predictive models. Traders can apply these metrics when working with time series data like price movements, trading volumes, or technical indicator values.
They are valuable in assessing model performance, identifying potential trend changes, and understanding market dynamics. The function is especially beneficial for quantitative traders, data scientists, and algorithmic strategy developers seeking precise statistical analysis
Keep exploring
What we’ve verified
Access, alerts and repainting behaviour have not been independently verified for this indicator. Check the creator’s current publication and settings.
General descriptions and classifications are recovered research. Verified details above identify the specific checks we have completed. Check the creator’s current publication for later changes.