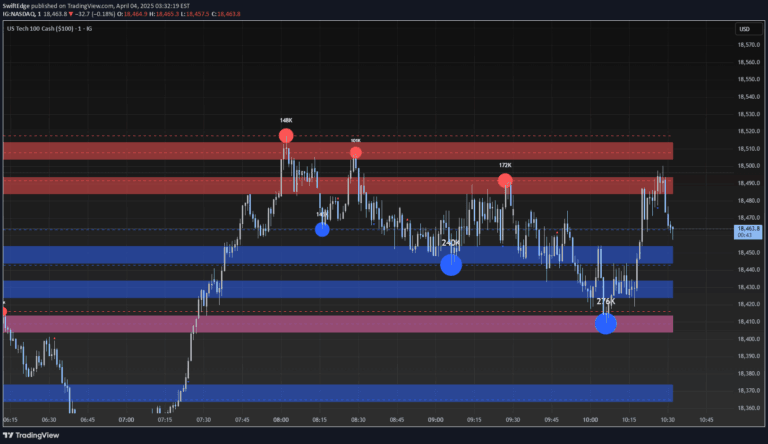
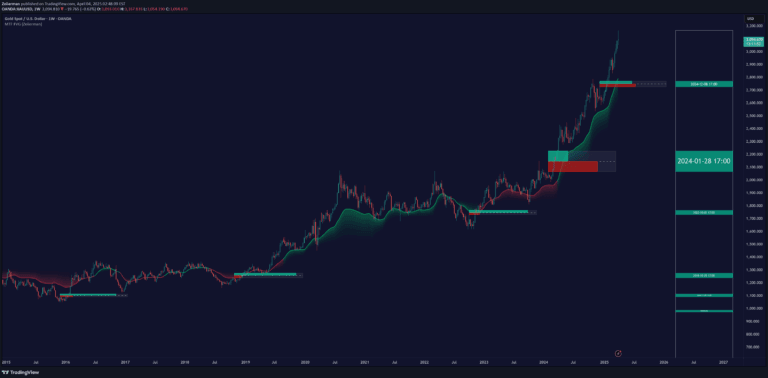
A dynamic indicator that identifies potential liquidity pools by tracking price interactions with specific zones, helping traders anticipate market movements and institutional trading strategies.
Explore complementary indicator rolesHow it works
The Liquidity Pools indicator identifies key price zones where traders are likely to place stop-limit orders by analyzing high and low wicked price areas. It tracks the number of times a zone is contacted, requiring a minimum number of interactions and specified bars between contacts to validate the liquidity pool.
The method uses three primary parameters: Zone Contact Amount, Bars Required Between Each Contact, and Confirmation Bars. These settings help filter and refine the zones, ensuring only significant and meaningful liquidity areas are highlighted on the chart.
Why it may be useful
Liquidity Pools provide traders with insights into potential institutional trading strategies by revealing areas where smaller market participants are likely to place risk management orders. By identifying these zones, traders can anticipate potential price movements and understand the psychological levels where market participants might enter or exit positions.
The indicator also accumulates volume data within these zones, offering additional context about the significance of each liquidity pool. This volume information helps traders assess the importance of specific zones and gauge the potential strength of future price interactions.
When to explore it
The Liquidity Pools indicator works best in markets with clear price action and identifiable swing points, such as forex, stocks, and cryptocurrency trading. Traders should use this indicator in conjunction with other technical analysis tools to confirm potential entry and exit points, especially during trending or ranging market conditions.
It is particularly useful for traders looking to understand market dynamics, identify potential support and resistance levels, and gain insights into institutional trading behaviors. The indicator can be especially effective when applied to timeframes that capture meaningful price movements, from intraday to weekly charts.
Keep exploring
What we’ve verified
Access, alerts and repainting behaviour have not been independently verified for this indicator. Check the creator’s current publication and settings.
General descriptions and classifications are recovered research. Verified details above identify the specific checks we have completed. Check the creator’s current publication for later changes.