Weekly RSI Buy/Sell Signals
A weekly RSI indicator that identifies potential buy and sell opportunities by tracking momentum through oversold and overbought levels on the 14-period RSI.
Explore 11,183 indicators. Filter beyond the obvious.
Discover the tools that fit the way you trade.
11,183 tools to explore
A weekly RSI indicator that identifies potential buy and sell opportunities by tracking momentum through oversold and overbought levels on the 14-period RSI.
VWAP is a volume-weighted average price indicator that tracks price movement relative to volume, helping traders identify potential support and resistance levels.
A moving average-based reversal indicator that generates trading signals by tracking market price position relative to a 13-period moving average, identifying potential trend changes.
Hull Waves indicator uses Hull Moving Averages to identify market trends and potential entry/exit points by analyzing price movements through dynamic visual lines and moving average crossovers.
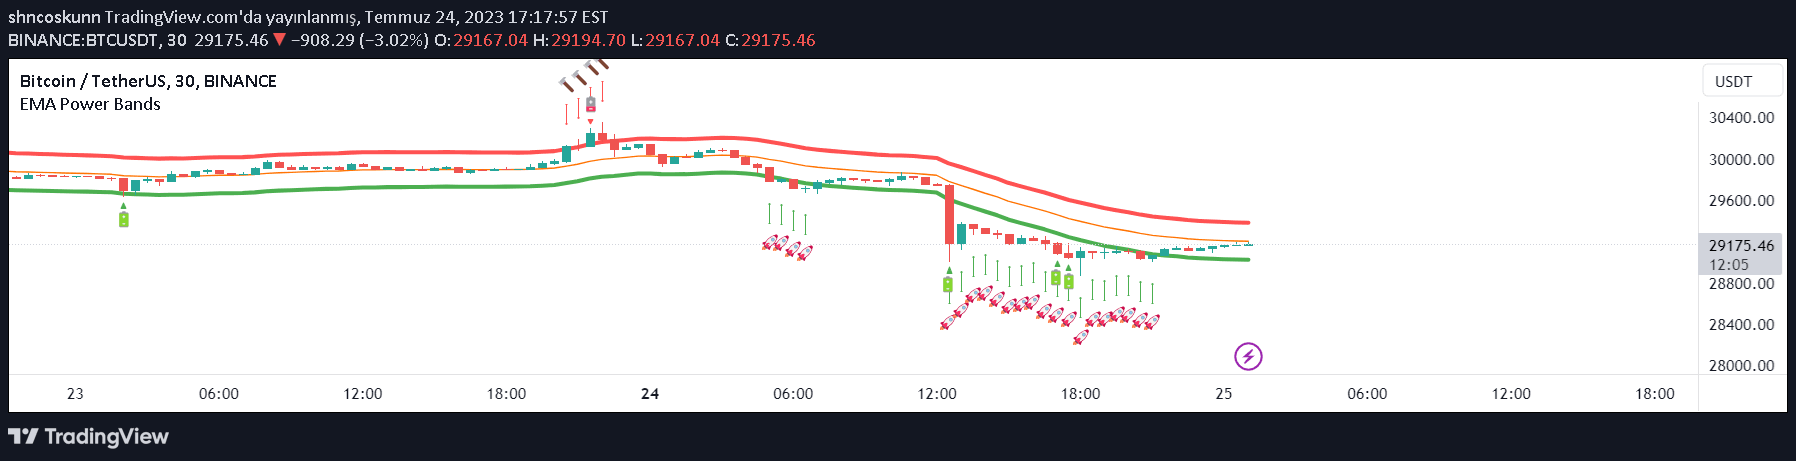
EMA Power Bands is a multi-indicator trading system that combines EMA, ATR, and RSI to generate buy and sell signals based on price trends, volatility, and momentum.
Likes, views, and comments are historical TradingView snapshots. They describe attention, not trading performance.