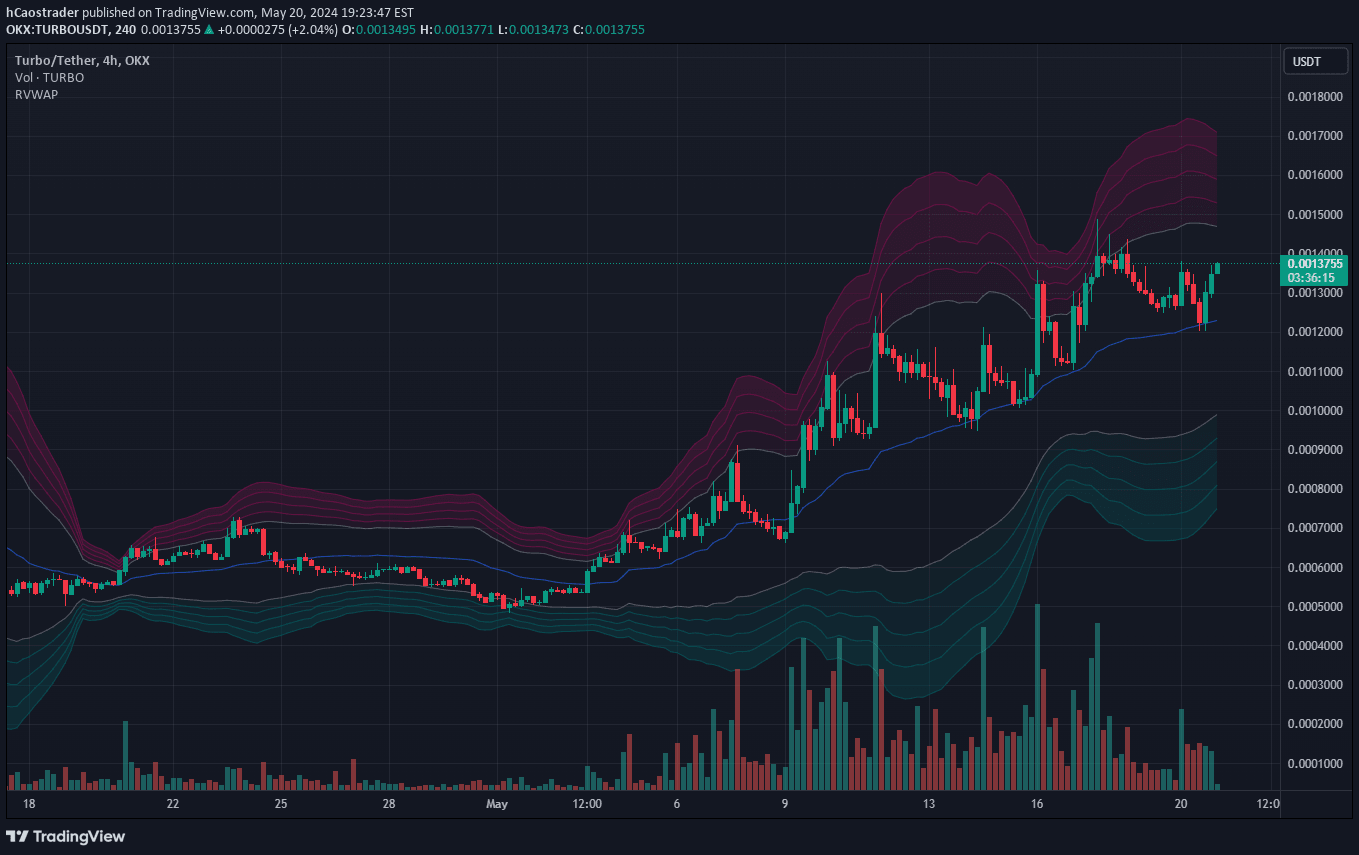
Anchored VWAP with standard deviation bands that provides dynamic support and resistance levels by calculating volume-weighted average price from a custom starting point.
Explore complementary indicator rolesHow it works
The Anchored VWAP calculates a volume-weighted average price starting from a user-defined anchor point, using the cumulative sum of price multiplied by volume divided by cumulative volume. This creates a dynamic baseline that represents the fair market price from the selected starting time.
Standard deviation bands are then plotted around this AVWAP, measuring price dispersion and volatility. These bands are calculated at three different levels - green, orange, and red - which represent increasingly extreme price movements from the central VWAP line.
Why it may be useful
The Anchored VWAP provides traders with a sophisticated tool for understanding market dynamics by integrating volume and price information from a specific starting point. It offers a more flexible approach to traditional VWAP by allowing traders to choose their own anchor time, which can be crucial for analyzing specific market events or trading sessions.
The standard deviation bands add another layer of analysis by visually representing market volatility and potential support/resistance zones. Traders can quickly identify overbought or oversold conditions, potential trend reversals, and key price levels that might trigger trading decisions.
When to explore it
This indicator is most effective during periods of significant market movement or when analyzing specific trading sessions with clear starting points. Intraday traders can use it to identify short-term mean reversion opportunities and confirm trend directions by observing price movements relative to the AVWAP.
Swing traders and trend followers can leverage the standard deviation bands to identify potential breakout points and assess market volatility. The indicator is particularly useful in markets with clear directional movements, helping traders validate trend strength and potential reversal zones.
Keep exploring
What we’ve verified
Access, alerts and repainting behaviour have not been independently verified for this indicator. Check the creator’s current publication and settings.
General descriptions and classifications are recovered research. Verified details above identify the specific checks we have completed. Check the creator’s current publication for later changes.