
YOUR INDICATOR RESEARCH STARTS HERE

Find the right indicator.
Understand what it does.

Explore 11,183 indicators. Filter beyond the obvious.
Discover the tools that fit the way you trade.

THE INDICATOR LIBRARY

Results for “CPR”

11,183 tools to explore

21 indicators matching your filters
Save search
TrendVolatilityEditor’s pick

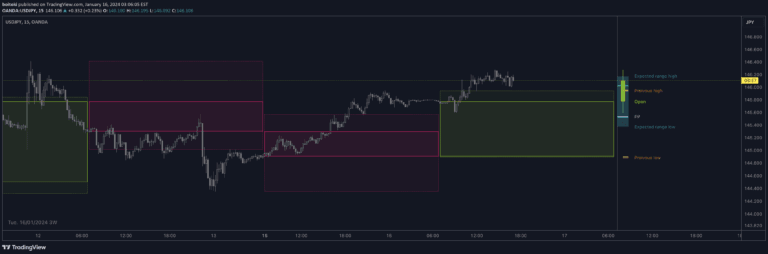
HTF Candles & Pivots

by boitoki

A multi-timeframe candle visualization tool that allows flexible display of historical price data with pivot point calculations and customizable viewing options.

Main price chart · unverifiedDay Trading · Swing Trading
Explore
1.9Klikes82.2Kviews88comments
Save
MomentumVolatility

Dynamic Price Oscillator (Zeiierman)

by Zeiierman

The Dynamic Price Oscillator (DPO) is a momentum indicator that measures price deviations from a moving average while integrating volatility adjustments and Bollinger Bands for advanced market analysis.

Separate pane · unverifiedDay Trading · Swing Trading
Explore
1.6Klikes38.9Kviews26comments
Save
LevelsTrendVolatility

CPR (Central Pivot Range)

by ajithcpas

Central Pivot Range (CPR) is a forecasting tool that calculates pivot points from previous trading sessions to predict market trends, volatility, and potential support and resistance levels.

Main price chart · unverifiedScalping · Day Trading
Explore
1.1Klikes25.1Kviews70comments
Save
ChannelsTrendVolatility

Curved Price Channels (Zeiierman)

by Zeiierman

A dynamic trading indicator that uses curved price channels to adapt to market volatility, providing flexible trend identification with built-in trend strength analysis.

Main price chart · unverifiedScalping · Day Trading
Explore
970likes15Kviews4comments
Save
LevelsSignalTrend

CPR by MT

by JITHIN_PS

The Central Pivot Range (CPR) is a technical analysis tool that identifies key support and resistance levels using the previous period's high, low, and closing prices.

Main price chart · unverifiedScalping · Day Trading
Explore
459likes7.2Kviews0comments
Save
TrendSignalLevels

CPR by NKD

by nikhilkdwivedi

Central Pivot Range (CPR) is a technical analysis tool that identifies key support and resistance levels using previous day's price data to help traders understand market trends and potential entry/exit points.

Main price chart · unverifiedScalping · Day Trading
Explore
441likes8.1Kviews8comments
Save
LevelsTrendVolatility

CPR - Central Pivot Range (by Alex L.)

by synth0

Central Pivot Range (CPR) is a technical indicator that helps traders identify support/resistance levels, trend direction, and potential price targets across multiple timeframes.

Main price chart · unverifiedScalping · Day Trading
Explore
373likes11.6Kviews0comments
Save
LevelsSignal

Pivot Points with MID Levels

by Sergioramos1987

Pivot Points indicator provides key support and resistance levels based on daily price data, helping traders identify potential entry and exit points across multiple timeframes.

Main price chart · unverifiedScalping · Day Trading
Explore
361likes7.7Kviews15comments
Save
LevelsSignalTrend

MERCURY by DrAbhiramSivprasad

by DRABHIRAMSS

A comprehensive trading indicator combining EMA, VWAP, and CPR to provide dynamic support and resistance levels, trend confirmation, and breakout alerts across multiple timeframes.

Main price chart · unverifiedDay Trading · Swing Trading
Explore
352likes5Kviews2comments
Save
LevelsSignal

CPR Weekly Variable Weekday Seller

by DeuceDavis

A weekly options trading strategy that uses Central Pivot Range (CPR) to determine option selling opportunities based on price action and predefined weekday expiration parameters.

Main price chart · unverifiedDay Trading · Swing Trading
Explore
303likes6.7Kviews18comments
Save
LevelsSignal

Nitin Swing Trading

by ShareTrading_

A pivot point indicator using monthly price action to identify key support and resistance levels for potential trading opportunities across different market conditions.

Main price chart · unverifiedDay Trading · Swing Trading
Explore
73likes3Kviews0comments
Save

Likes, views, and comments are historical TradingView snapshots. They describe attention, not trading performance.

START WITH A QUESTION

A little less searching.
A lot more understanding.

Tell DeepAlpha what you need. Get an explanation, a shortlist,
and a direct path to the indicators behind it.

Ask DeepAlpha