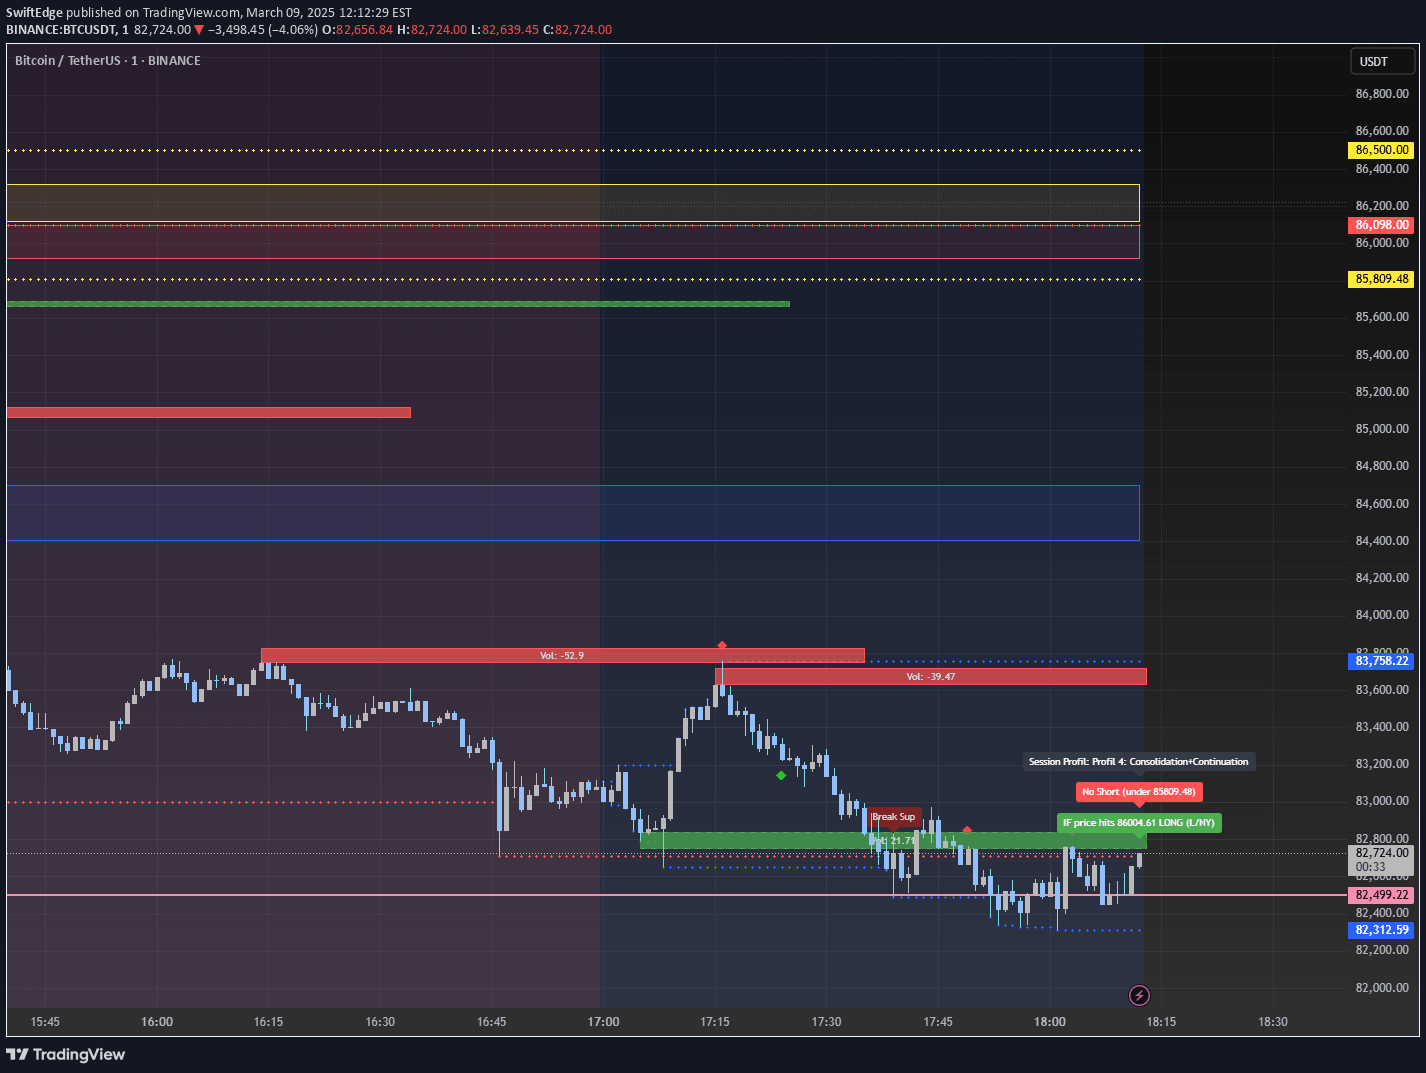
A probabilistic technical indicator using Poisson distribution to project dynamic support and resistance levels with varying transparency based on historical price interactions.
Explore complementary indicator rolesHow it works
The Poisson Projection calculates horizontal strata levels around the current closing price using a defined increment. It then analyzes historical price touches within these levels across five forecast iterations spaced by Fibonacci sequences (2, 3, 5, 8, and 13 bars ahead).
For each stratum and iteration, the indicator counts touches within a lookback window and calculates Poisson probabilities. These probabilities determine the transparency of each level, with higher probabilities resulting in more opaque lines, visually highlighting statistically significant price interaction zones.
Why it may be useful
This indicator bridges traditional technical analysis with advanced statistical modeling, offering traders a nuanced view of potential support and resistance levels. By quantifying price level interactions through probabilistic methods, it provides a more sophisticated approach to identifying key market zones beyond conventional visual techniques.
The Poisson Projection transforms abstract price levels into a visually intuitive representation, allowing traders to quickly assess the historical significance of different price zones. Its dynamic transparency mapping creates an immediate visual cue about the likelihood of price interactions, enhancing decision-making and strategic planning.
When to explore it
The Poisson Projection works best in markets with clear historical price patterns and relatively consistent volatility. It is particularly effective for traders seeking a data-driven approach to identifying potential support and resistance levels across various timeframes and market conditions.
Traders can optimize this indicator by carefully selecting the strata increment, lookback window, and probability threshold to match specific market characteristics. It is especially valuable when combined with other technical analysis tools to confirm potential entry, exit, and risk management strategies.
Keep exploring
What we’ve verified
Access, alerts and repainting behaviour have not been independently verified for this indicator. Check the creator’s current publication and settings.
General descriptions and classifications are recovered research. Verified details above identify the specific checks we have completed. Check the creator’s current publication for later changes.