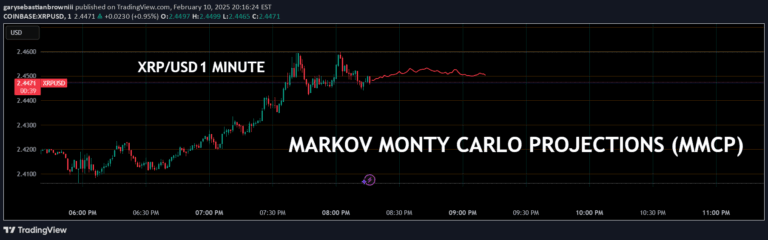
A financial modeling tool using Geometric Brownian Motion to simulate potential price trajectories, helping traders visualize potential market movements and assess associated risks.
Explore complementary indicator rolesHow it works
The Geometric Brownian Motion (GBM) indicator uses mathematical simulations to model potential price movements by incorporating key financial parameters. It generates multiple price trajectories based on the asset's expected growth rate (μ), volatility (σ), and random noise term, creating a probabilistic forecast of future price developments.
By running numerous simulations, the indicator creates a range of potential price paths that help traders understand the potential variability of an asset's future performance. Each simulated trajectory represents a possible price evolution, allowing traders to assess different scenarios and potential market outcomes.
Why it may be useful
This indicator provides traders with a sophisticated probabilistic approach to understanding market dynamics, moving beyond traditional deterministic forecasting methods. By generating multiple potential price scenarios, it offers insights into potential risks and opportunities that might not be apparent through standard technical analysis.
The GBM simulation helps traders make more informed decisions by quantifying potential market uncertainties. It allows for a deeper understanding of an asset's potential price movements, providing valuable context for risk management and strategic trading planning.
When to explore it
The Geometric Brownian Motion indicator is most effective when traders want to explore potential future price scenarios for a financial asset with significant uncertainty. It works best in markets with moderate to high volatility, where understanding potential price ranges and distributions can provide strategic insights.
Traders should utilize this tool when developing comprehensive trading strategies, conducting risk assessments, or evaluating potential investment scenarios. It is particularly useful for long-term strategic planning, portfolio management, and understanding potential market variations across different time horizons.
Keep exploring
What we’ve verified
Access, alerts and repainting behaviour have not been independently verified for this indicator. Check the creator’s current publication and settings.
General descriptions and classifications are recovered research. Verified details above identify the specific checks we have completed. Check the creator’s current publication for later changes.