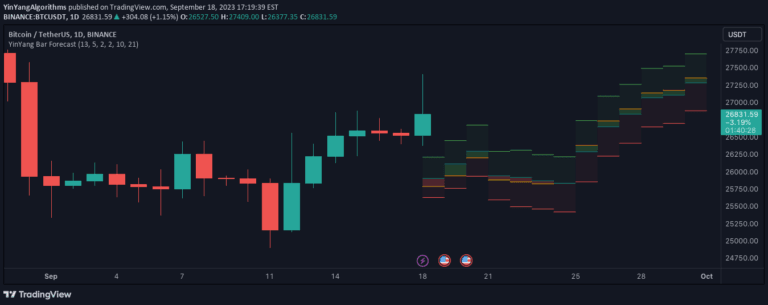
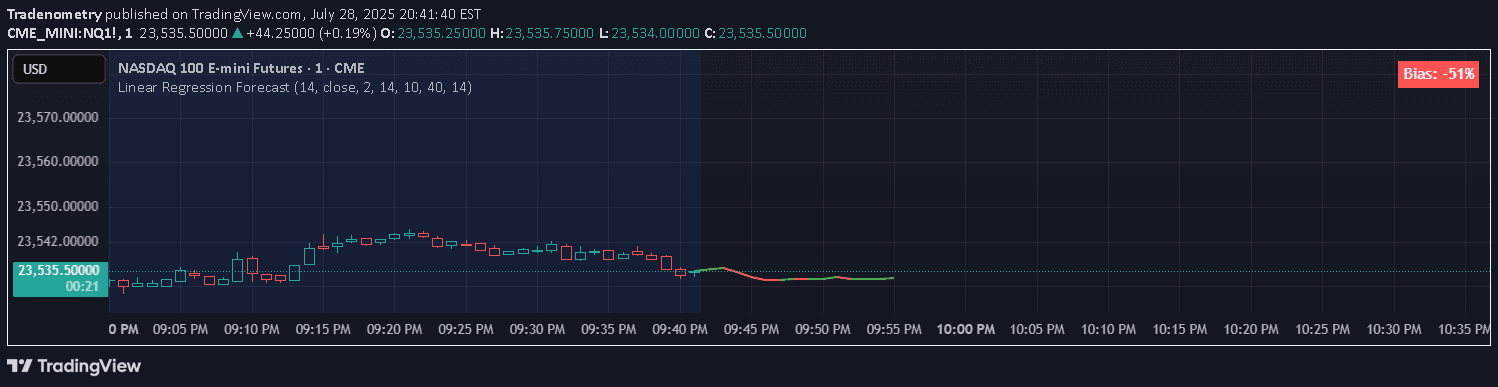
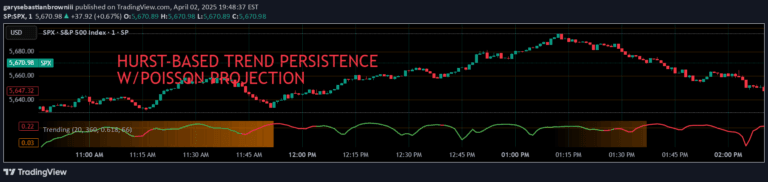
A sophisticated trading tool analyzing historical price movements across daily, weekly, and monthly timeframes to forecast potential seasonal trends and market patterns.
Explore complementary indicator rolesHow it works
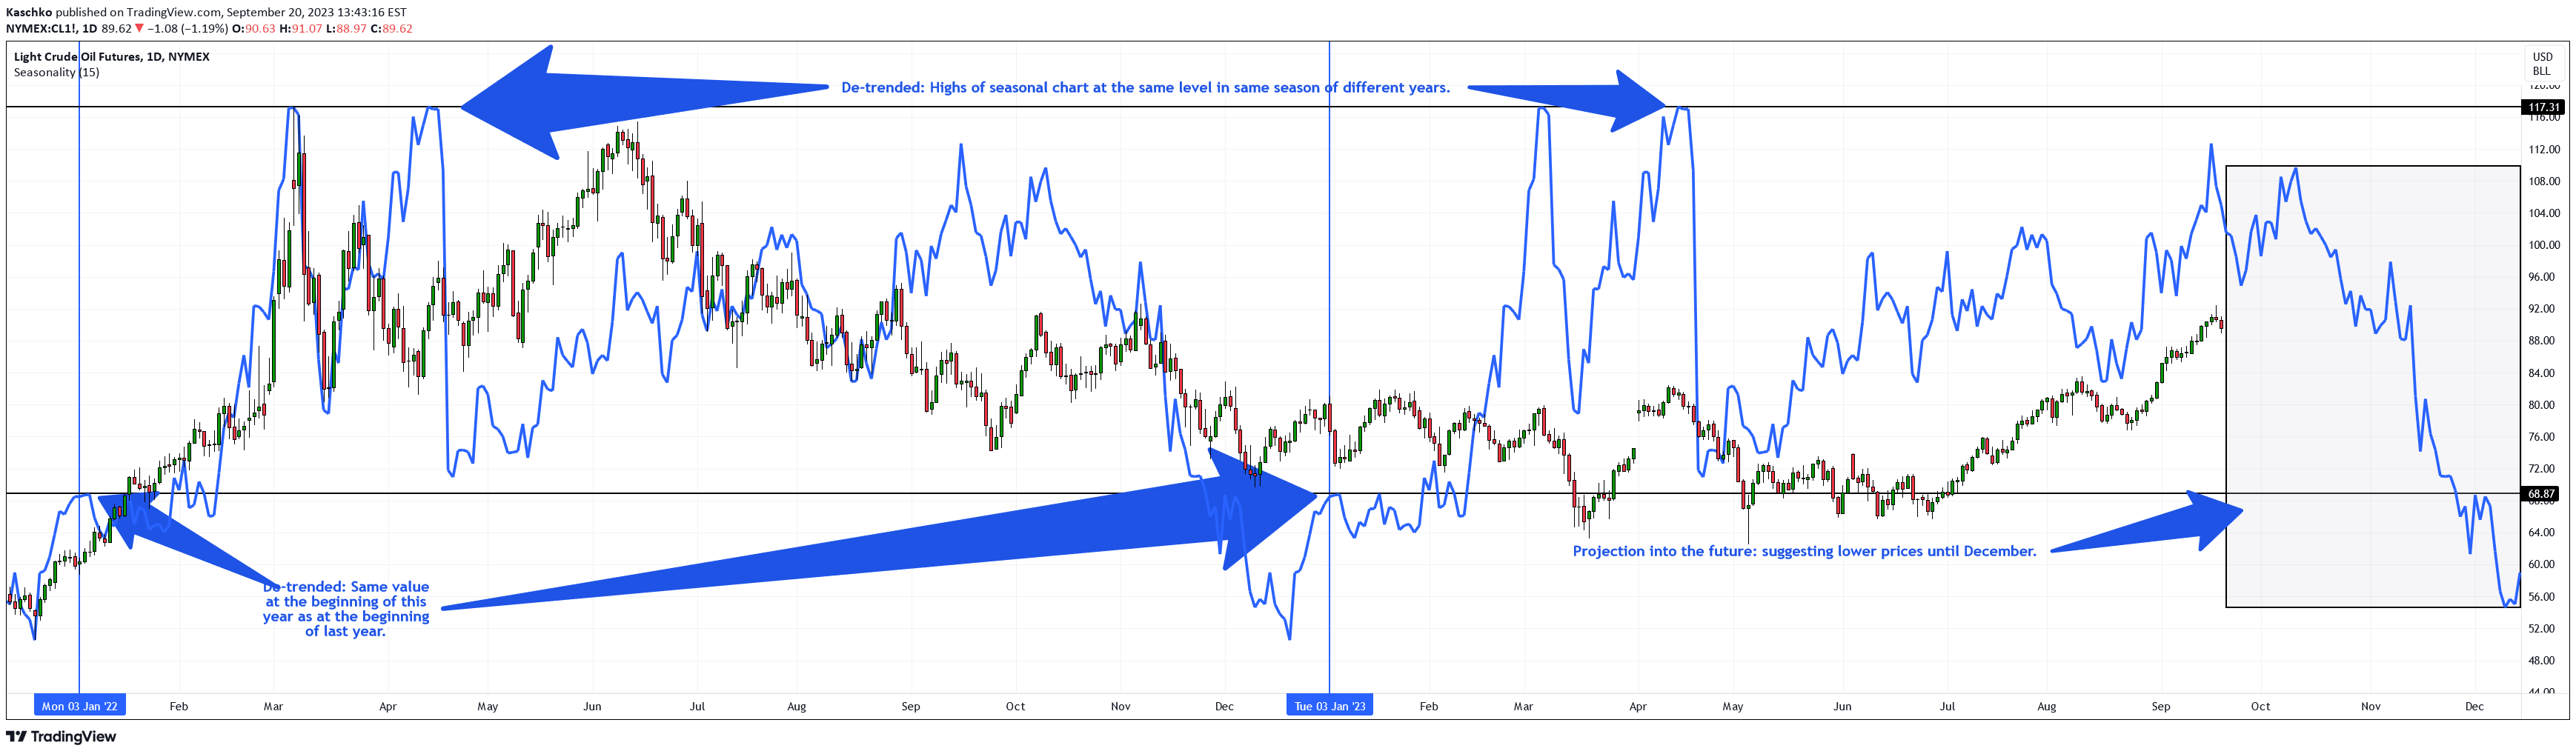
The Seasonality Forecast indicator processes historical price data by calculating average price changes from one bar to the next, creating a comprehensive seasonal chart. It employs advanced de-trending techniques to standardize data across different years, ensuring accurate comparative analysis without the influence of overarching price trends.
By utilizing time series analysis and statistical smoothing methods, the indicator identifies cyclical patterns and potential market turning points. The algorithm detects pivot points based on historical price actions, applying smoothing techniques like moving averages to clarify underlying market trends and reduce short-term volatility.
Why it may be useful
This indicator provides traders with a nuanced perspective on market behavior by revealing long-term seasonal patterns that might otherwise remain hidden in raw price data. By extracting cyclical trends, it offers insights into potential future market movements, helping traders make more informed strategic decisions.
The tool's ability to standardize and analyze historical data across multiple timeframes enables traders to understand recurring market dynamics. It transforms complex historical price information into actionable insights, allowing traders to anticipate potential trend reversals, adjust risk management strategies, and develop more robust trading approaches.
When to explore it
The Seasonality Forecast indicator is most effective for traders seeking to understand long-term market trends and seasonal patterns that extend beyond short-term price fluctuations. It is particularly valuable for swing traders and investors who are interested in identifying recurring market behaviors across extended time periods.
Traders should utilize this indicator when developing strategic trading plans, especially in markets with known seasonal characteristics such as commodities, agricultural products, or specific stock sectors. It is most beneficial when combined with other technical analysis tools and fundamental research to provide a comprehensive market analysis approach.
Keep exploring
What we’ve verified
Access, alerts and repainting behaviour have not been independently verified for this indicator. Check the creator’s current publication and settings.
General descriptions and classifications are recovered research. Verified details above identify the specific checks we have completed. Check the creator’s current publication for later changes.