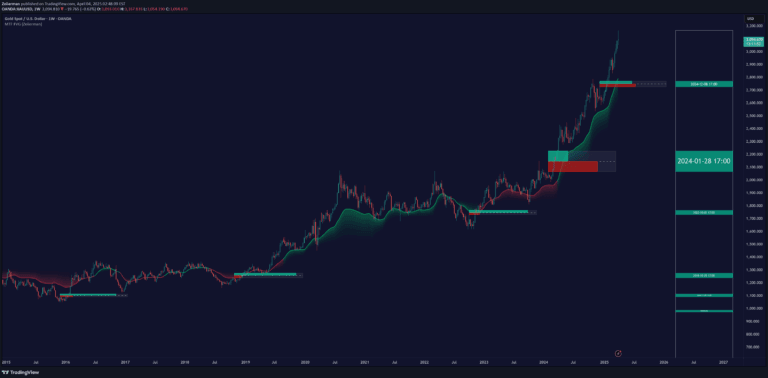
Support and Resistance (High Volume Boxes) [ChartPrime]
A volume-based support and resistance indicator that identifies key trading levels through pivot points and volume analysis, providing visual cues for potential price reversals.
Explore 11,183 indicators. Filter beyond the obvious.
Discover the tools that fit the way you trade.
11,183 tools to explore
A volume-based support and resistance indicator that identifies key trading levels through pivot points and volume analysis, providing visual cues for potential price reversals.
A dynamic trend indicator using Zero-Lag Moving Average and EMA to detect market momentum shifts, highlighting trend reversal levels and potential price zones.
A customizable market session tracker displaying trading hours for Tokyo, London, New York, and Sydney with multiple visualization options and advanced trading insights.
An advanced script that identifies and visualizes pivot points, helping traders recognize market structure, potential support/resistance levels, and trading opportunities through customizable swing high and low indicators.
A dynamic trading indicator that identifies potential breakout opportunities by visualizing price ranges and offering customizable risk management through target and stop loss settings.
A comprehensive trading toolkit combining RSI divergences, correction zones, and advanced support/resistance levels to help traders analyze market movements and potential trend reversals.
A volume profile indicator that visualizes trading volume across different time frames using lines and boxes, providing unique insights into volume distribution and market activity.
Kalman Trend Levels is an advanced indicator that identifies trend shifts, support/resistance zones, and momentum changes using dynamic Kalman filter crossovers and adaptive visualization techniques.
Advanced volume analysis tool that creates a heatmap and volume profile, providing detailed insights into trading volume, price movements, and market structure across different time frames.
A dynamic trend analysis tool using Hull-EMA curves that color-codes price bars, plots support/resistance boxes, and identifies high-probability breakout retests for traders.
A volume footprint indicator that divides candles into intervals, showing the distribution of trading volume across different price levels within a single candlestick.
A multitimeframe indicator identifying institutional Fair Value Gaps through price imbalances, volume analysis, and trend filtering to highlight potential market inefficiencies and trading opportunities.
Likes, views, and comments are historical TradingView snapshots. They describe attention, not trading performance.