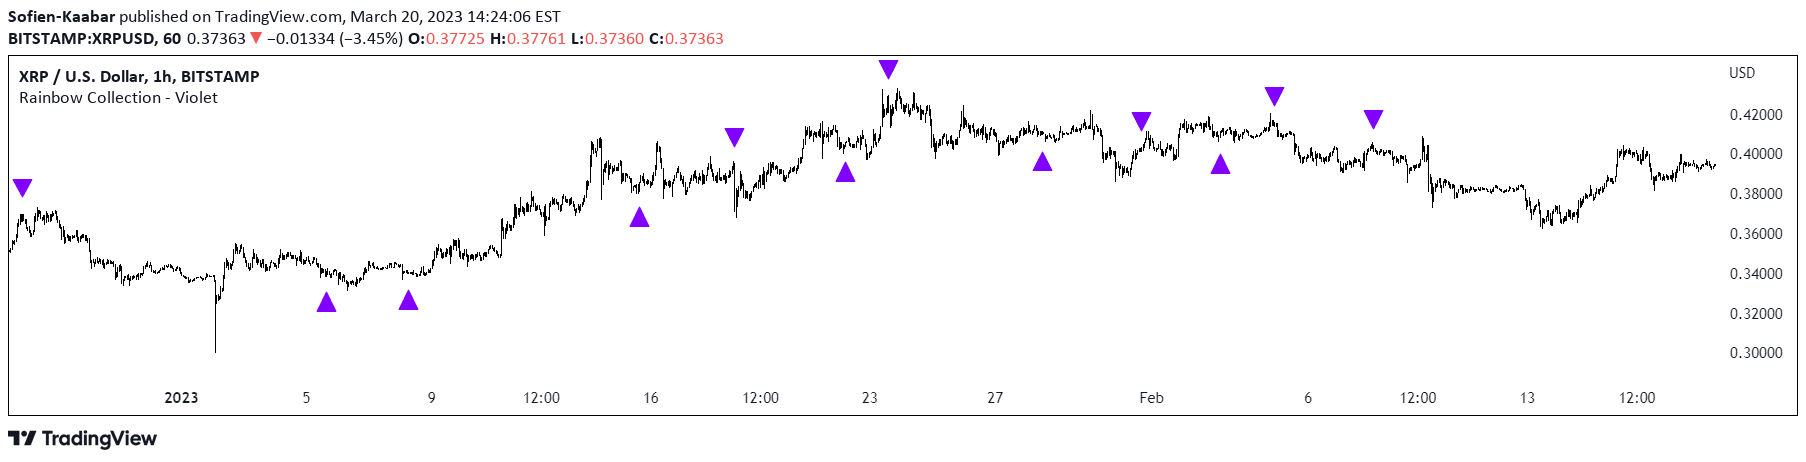
A dynamic trend visualization indicator using Simple Moving Average crossovers to identify potential buy and sell signals across different market conditions and timeframes.
Explore complementary indicator rolesHow it works
The Dynamic Trend Visualization Indicator operates by tracking the crossover points between two Simple Moving Averages (SMAs) of different time periods. When the shorter-term SMA crosses above the longer-term SMA, it generates a buy signal, indicating a potential upward trend. Conversely, when the shorter-term SMA crosses below the longer-term SMA, it produces a sell signal, suggesting a potential downward trend.
Traders can customize the SMA periods to suit their specific trading strategy, with typical configurations ranging from short-term (5 and 21) for quick trades to long-term (50 and 200) for identifying major market trends. The indicator provides visual lines and labels to clearly mark these crossover points, making it easy for traders to identify potential entry and exit opportunities.
Why it may be useful
The Dynamic Trend Visualization Indicator is crucial for traders seeking to understand and capitalize on market trends across different timeframes. By providing a clear visual representation of trend changes, it helps traders make more informed decisions about potential entry and exit points. The indicator's flexibility allows it to be adapted to various trading styles, from scalping to long-term investing.
Moreover, the tool simplifies complex trend analysis by reducing market movements to clear, actionable signals. It helps traders cut through market noise and focus on significant trend changes, potentially improving decision-making and reducing emotional trading responses. The customizable nature of the indicator makes it valuable for both novice and experienced traders.
When to explore it
The indicator works best in markets with clear, defined trends, particularly in assets that show consistent directional movement. It is most effective in trending markets such as forex, stocks, and commodities where price movements follow recognizable patterns. Traders can optimize its use by selecting appropriate SMA periods that match the specific characteristics of the traded asset and desired trading timeframe.
However, traders should exercise caution when using this indicator in sideways or highly volatile markets. In range-bound conditions, the frequent crossovers can generate multiple false signals, potentially leading to unnecessary trades and increased transaction costs. It is recommended to combine this indicator with other technical analysis tools like volume indicators or momentum oscillators to confirm signals and improve overall trading accuracy.
Keep exploring
What we’ve verified
Access, alerts and repainting behaviour have not been independently verified for this indicator. Check the creator’s current publication and settings.
General descriptions and classifications are recovered research. Verified details above identify the specific checks we have completed. Check the creator’s current publication for later changes.