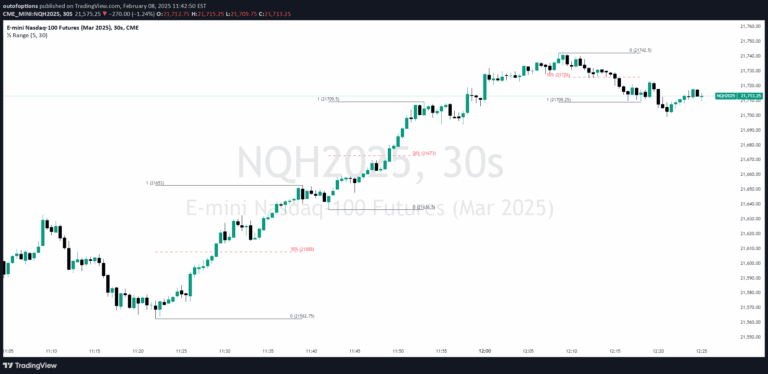
Liquidity Swings & Sweeps
A Pine script indicator tracking liquidity levels and sweeps, identifying key price points where market direction may change using swing highs and lows with strength rating.
Explore 11,183 indicators. Filter beyond the obvious.
Discover the tools that fit the way you trade.
11,183 tools to explore
A Pine script indicator tracking liquidity levels and sweeps, identifying key price points where market direction may change using swing highs and lows with strength rating.
A technical analysis tool that identifies and highlights equal highs and lows on a trading chart, marking potential support and resistance zones while providing dynamic visual cues.
A trading indicator that identifies price zones using Over-The-Edge (OTE) levels to help traders locate discounted and premium areas for potential entry and exit points.
A Pine script indicator that identifies price inefficiencies through Volume Gaps and Imbalances, highlighting potential liquidity zones where price may seek rebalancing and future movement.
Smart Money Technique Divergence identifies potential market shifts by analyzing discrepancies between correlated assets, revealing hidden market dynamics through pivot and liquidity analysis.
A price range indicator that identifies 50% retracement zones between swing highs and lows, providing potential entry and target points for traders based on price action dynamics.
A comprehensive trading indicator that visualizes key price levels across different trading sessions, providing critical market insights and configurable visualization options for traders.
A Pine script indicator that identifies and tracks relative equal highs and lows with configurable variance, helping traders spot potential trend reversals and liquidity zones.
A trading indicator identifying price inefficiencies through Flat Top/Bottom Candles, highlighting zones where market manipulation might occur and potential price rebalancing opportunities.
A dynamic volatility indicator comparing daily price range to average true range, color-coding movement intensity to help traders quickly assess market volatility and potential trading opportunities.
Likes, views, and comments are historical TradingView snapshots. They describe attention, not trading performance.